All orders are final. Please contact a member of The Fractional Analyst for a paid consultation (subject to current rates).
Comparables Module
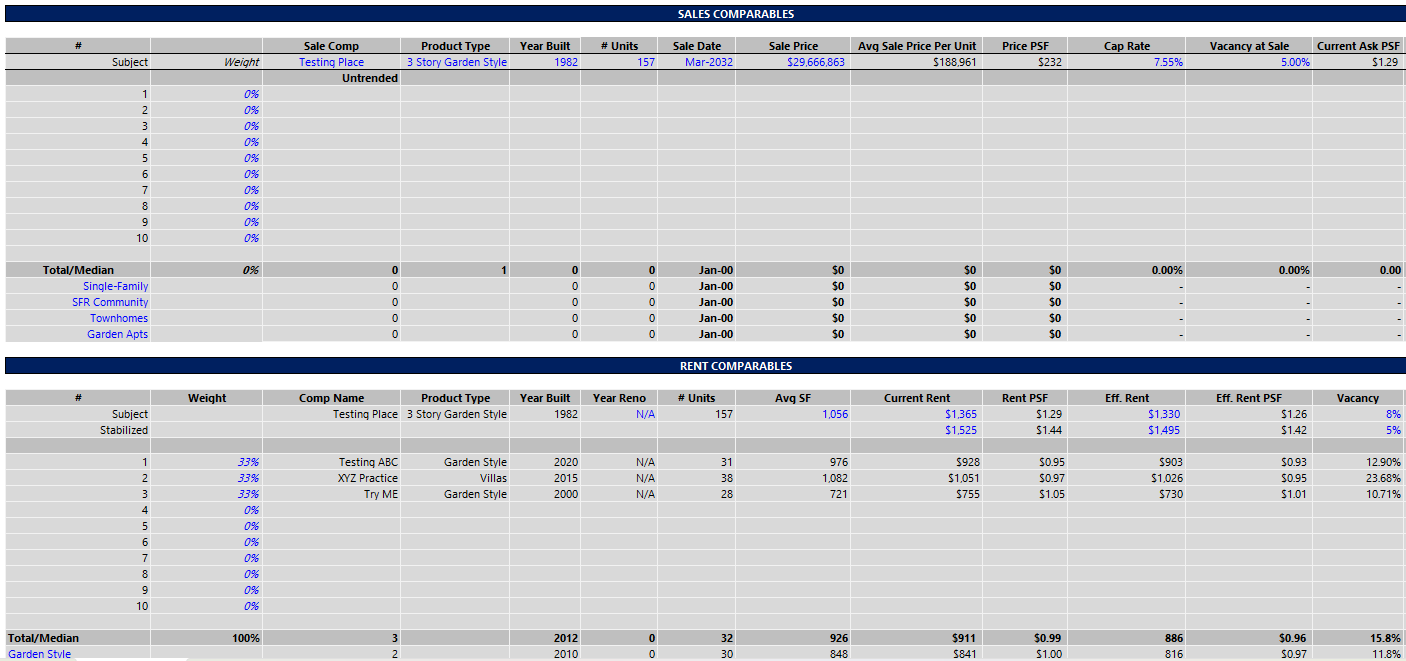
This easy-to-use spreadsheet integrates seamlessly with your existing multifamily CRE models, allowing you to compare rent and sale assumptions to local market properties. Designed for simplicity, it helps you uncover actionable insights for accurate benchmarking and informed decision-making.
Compare subject property rents and sale prices to local comparable properties.
Analyze key metrics like sale price per unit, effective rents, and unit mixes.
Save time with a ready-to-use format that fits directly into your workflow.
Samples
Sales Input & Rent Comps Output
Rent Comps Input Sheet
The Fractional Analyst’s
Build To Rent Model
Upgrade your underwriting process with our model that delivers speed, accuracy, and confidence across all your multifamily deals


