

Mixed-Use Development

TFA Mixed-Use Development Model
The TFA Mixed-Use Development Model is a comprehensive underwriting tool designed for projects that combine multifamily residential units with significant commercial components such as retail, office, or ground-floor shops. This model provides developers, investors, and capital partners with a clear, data-driven framework to evaluate complex, multi-use projects.
Whether you’re structuring financing, analyzing feasibility, or presenting returns to stakeholders, the model integrates residential and commercial assumptions into a single, streamlined platform.
Key Features
Dual-Focus Assumptions – Model multifamily and commercial components independently while capturing blended project returns.
Robust Construction Budgeting – Track development costs across sitework, residential, and retail construction.
Integrated Financing Schedules – Build and evaluate construction loans, permanent financing, and blended capital stacks.
Return on Cost Analysis – Compare multifamily, retail, and combined project yields to understand profitability drivers.
Equity Waterfall Mechanics – Capture GP/LP distributions with institutional-style waterfall modeling.
Scenario Flexibility – Stress-test unit absorption, rent comps, cap rates, and commercial lease-up assumptions.
What’s Inside the Model
Deal Summary & Returns
Deals & Returns – Snapshot of main deal points with blended economics.
Return on Cost – Clear look at untrended yields for multifamily, retail, and blended components.
Financials & Operations
Annual P&L – Yearly profit & loss across all uses.
Monthly P&L – Detailed month-by-month operating cash flows.
Project Assumptions
Project Assumptions – Apartments – Multifamily unit count, rents, and absorption inputs.
Project Assumptions – Retail – Commercial lease-up, rents, and tenanting assumptions.
Development & Capitalization
Construction Budget – Line-item construction budget for residential and retail components.
Financing Schedule – Construction and permanent loan schedules with draw modeling.
Equity Waterfall – GP/LP distributions across the project lifecycle.
Market Benchmarking
Comp Analysis – Rent comps, sales comps, and development pipeline benchmarking.
Easily analyze, manage, and optimize your mixed-use development projects with this all-in-one financial model. Designed for precision and clarity, it’s the ultimate tool for developers and investors.
Fit for mixed-used developments that include inline retail.
Includes a detailed construction budget, financing schedule, and comp analysis.
Robust partnership return projections for accurate forecasts.
TFA Mixed-Use Development Model
The TFA Mixed-Use Development Model is a comprehensive underwriting tool designed for projects that combine multifamily residential units with significant commercial components such as retail, office, or ground-floor shops. This model provides developers, investors, and capital partners with a clear, data-driven framework to evaluate complex, multi-use projects.
Whether you’re structuring financing, analyzing feasibility, or presenting returns to stakeholders, the model integrates residential and commercial assumptions into a single, streamlined platform.
Key Features
Dual-Focus Assumptions – Model multifamily and commercial components independently while capturing blended project returns.
Robust Construction Budgeting – Track development costs across sitework, residential, and retail construction.
Integrated Financing Schedules – Build and evaluate construction loans, permanent financing, and blended capital stacks.
Return on Cost Analysis – Compare multifamily, retail, and combined project yields to understand profitability drivers.
Equity Waterfall Mechanics – Capture GP/LP distributions with institutional-style waterfall modeling.
Scenario Flexibility – Stress-test unit absorption, rent comps, cap rates, and commercial lease-up assumptions.
What’s Inside the Model
Deal Summary & Returns
Deals & Returns – Snapshot of main deal points with blended economics.
Return on Cost – Clear look at untrended yields for multifamily, retail, and blended components.
Financials & Operations
Annual P&L – Yearly profit & loss across all uses.
Monthly P&L – Detailed month-by-month operating cash flows.
Project Assumptions
Project Assumptions – Apartments – Multifamily unit count, rents, and absorption inputs.
Project Assumptions – Retail – Commercial lease-up, rents, and tenanting assumptions.
Development & Capitalization
Construction Budget – Line-item construction budget for residential and retail components.
Financing Schedule – Construction and permanent loan schedules with draw modeling.
Equity Waterfall – GP/LP distributions across the project lifecycle.
Market Benchmarking
Comp Analysis – Rent comps, sales comps, and development pipeline benchmarking.
Key Features
Dual-Focus Assumptions
Model multifamily and commercial components independently while capturing blended project returns.
Robust Construction Budgeting
Track development costs across sitework, residential, and retail construction.
Integrated Financing Schedules
Build and evaluate construction loans, permanent financing, and blended capital stacks.
Return on Cost Analysis
Compare multifamily, retail, and combined project yields to understand profitability drivers.
Equity Waterfall Mechanics
Capture GP/LP distributions with institutional-style waterfall modeling.
Scenario Flexibility
Stress-test unit absorption, rent comps, cap rates, and commercial lease-up assumptions.
What’s Inside the Model
Deal Summary & Returns
Deals & Returns – Snapshot of main deal points with blended economics.
Return on Cost – Clear look at untrended yields for multifamily, retail, and blended components.
Financials & Operations
Annual P&L – Yearly profit & loss across all uses.
Monthly P&L – Detailed month-by-month operating cash flows.
Project Assumptions
Project Assumptions – Apartments – Multifamily unit count, rents, and absorption inputs.
Project Assumptions – Retail – Commercial lease-up, rents, and tenanting assumptions.
Development & Capitalization
Construction Budget – Line-item construction budget for residential and retail components.
Financing Schedule – Construction and permanent loan schedules with draw modeling.
Equity Waterfall – GP/LP distributions across the project lifecycle.
Market Benchmarking
Comp Analysis – Rent comps, sales comps, and development pipeline benchmarking.
Samples
Summary Fields
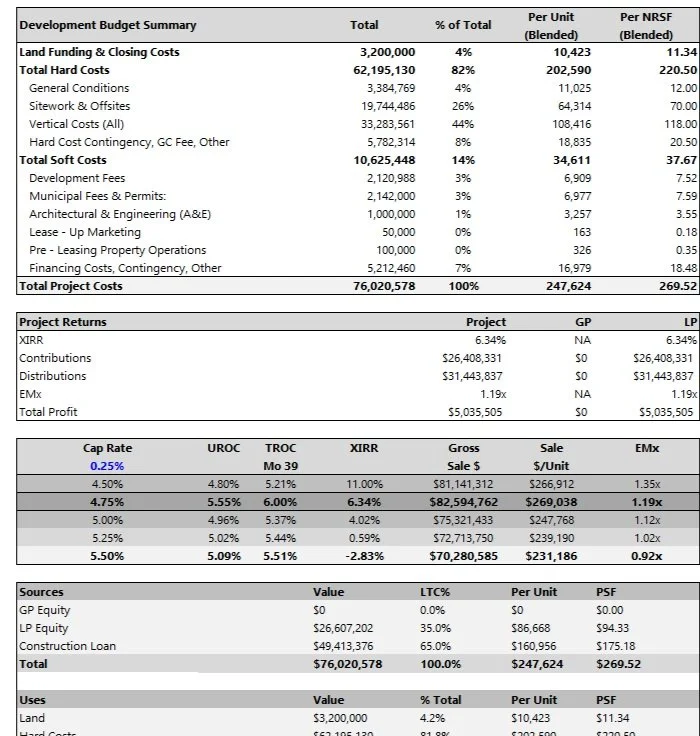
Investor Tear Sheet

Apartment Input Sheet

Construction Budget

Retail Inputs

Comparables Sheet

The Fractional Analyst’s
Mixed-Use Development Model
Upgrade your underwriting process with our model that delivers speed, accuracy, and confidence across all your multifamily deals
TFA Mixed-Use Development Model
The TFA Mixed-Use Development Model is a comprehensive underwriting tool designed for projects that combine multifamily residential units with significant commercial components such as retail, office, or ground-floor shops. This model provides developers, investors, and capital partners with a clear, data-driven framework to evaluate complex, multi-use projects.
Whether you’re structuring financing, analyzing feasibility, or presenting returns to stakeholders, the model integrates residential and commercial assumptions into a single, streamlined platform.
Key Features
Dual-Focus Assumptions – Model multifamily and commercial components independently while capturing blended project returns.
Robust Construction Budgeting – Track development costs across sitework, residential, and retail construction.
Integrated Financing Schedules – Build and evaluate construction loans, permanent financing, and blended capital stacks.
Return on Cost Analysis – Compare multifamily, retail, and combined project yields to understand profitability drivers.
Equity Waterfall Mechanics – Capture GP/LP distributions with institutional-style waterfall modeling.
Scenario Flexibility – Stress-test unit absorption, rent comps, cap rates, and commercial lease-up assumptions.
What’s Inside the Model
Deal Summary & Returns
Deals & Returns – Snapshot of main deal points with blended economics.
Return on Cost – Clear look at untrended yields for multifamily, retail, and blended components.
Financials & Operations
Annual P&L – Yearly profit & loss across all uses.
Monthly P&L – Detailed month-by-month operating cash flows.
Project Assumptions
Project Assumptions – Apartments – Multifamily unit count, rents, and absorption inputs.
Project Assumptions – Retail – Commercial lease-up, rents, and tenanting assumptions.
Development & Capitalization
Construction Budget – Line-item construction budget for residential and retail components.
Financing Schedule – Construction and permanent loan schedules with draw modeling.
Equity Waterfall – GP/LP distributions across the project lifecycle.
Market Benchmarking
Comp Analysis – Rent comps, sales comps, and development pipeline benchmarking.
What our customers are saying
-
![Smiling man in a dark suit with a light shirt standing in front of a glass building.]()
"The Fractional Analyst team stepped in when we had a gap in our analyst pool. They have been working with us for about two years. They have seamlessly provided the expertise and support we needed to streamline our operations and make smarter, data-driven decisions."
Clay Heighten - Principal
Caddis Partners
-
![Professional man in a blue suit and light blue shirt smiling against a plain white background.]()
"Our family office needed a solution to manage legacy real estate assets. They have been instrumental to streamline our valuation and underwriting processes."
James Gueits - Principal
MHP Operator
-
![Stylized green tree inside a circular dark background design.]()
"We had a robust multifamily acquisition pipeline in Q2/Q3 '25 and needed additional support. The Fractional Analyst team knocked out over 50 underwritings for us in that time period and provided valuable market research in the process."
Oakdale Capital
-
![A bald man with a beard smiling outdoors, wearing a blue plaid shirt with a blurred green garden background.]()
"We had some advanced modeling needs in the affordable housing space. The Fractional Analyst team dove into our financial model and our comparables template and automated quite a bit, saving my team dozens of hours, so we can focus on doing deals. Great team!"
Robert Sheppard - Founder, Managing Partner
Vital Housing
-
![A professional man wearing glasses, a dark suit, a light blue shirt, and a patterned tie, smiling against a plain gray background.]()
"Having a tailored and precise model became the cornerstone of our capital raising efforts. The TFA team's ability to simplify complex structures gave me & my investors the confidence to move forward."
Justin Britto - Founding Partner
CenTria Living
-
![A smiling man outdoors in a snowy setting with a large building in the background.]()
"I needed a mixed-use development model that would impress key stakeholders. Their model provided an exceptional level of detail, making it easy to present insights to our investors."
Tamer Celik - COO
VisoneCo
-
![Silhouette of a man's profile with a glowing blue circle behind him on a black background.]()
"My banker was appalled with my partner's model. When he saw what The Fractional Analyst team put together, the approval process was infinitely smoother."
Robert Dew - Principal
Castello Divino
-
![Smiling man with gray hair, glasses, and beard in an indoor setting.]()
"Their meticulous attention to detail ensured my reports were backed by solid data. Their support has been invaluable, and I highly recommend their services to anyone in the industry!"
Steven Fox - Appraiser
Binyan Kesef
-
![A young man with curly brown hair smiling outdoors near a beach or lake.]()
"The Fractional Analyst team provided an institutional-grade industrial acquisition model and complementary pitch deck to support our capital raise. Great and efficient process!"
Aiden Samuels - Partner
Avid Asset Management
-
![White stylized airplane icon on a gold background]()
"We needed a debt book and supporting market data for a luxury for-sale home development in the rockies. The design and analyst team at The Fractional Analyst knocked it out of the park."
Dean Sparks - Founder & CEO
Altoma Real Estate Advisors
-
![Silhouette of a person's profile in front of a bright blue circular light against a black background.]()
"I am a private practice physician. I have little experience with real estate finance. I engaged The Fractional Analyst team for financial modeling support. Not only did they provide a sophisticated model, they walked me through how to use it and present it to my bank. Exceptional team!"
Parker Velargo - Physician
-
![A man with glasses and a beard wearing a purple polo shirt standing against a plain white wall.]()
"I needed a model for single family development. The mixed-use development from The Fractional Analyst was a good start. Really looking forward to CoreCast!"
Doug Taylor - Owner
Safe Haven Homes, LLC
-
![A young man with curly hair, glasses, and a beard, dressed in a black suit, white checkered shirt, and black tie, against a plain background.]()
"I needed some additional support on a LIHTC underwriting project. The Fractional Analyst team had it turned back around in a week. Great group!"
Delvin Hall - Founding Principal
Onyx Equity Partners
-
![A smiling woman with dark hair and bangs, wearing a white top, standing outdoors with trees and a river in the background.]()
"I have downloaded a few resources from The Fractional Analyst. As a broker, it's always nice to have professional resources readily available to show to clients."
Sarah Humbargar - Associate Broker
Sherpa CRE
-
![Silhouette of a man's profile in front of a bright blue circle against a black background.]()
"The financial models from The Fractional Analyst are top notch. I purchased the multifamily acquisition model and the mixed-use development model. I needed a few upgrades, and the team was quick to provide them."
Jason Glick - Principal
GPG Properties
-
![Silhouette of a man in profile against a blue circular light source on a black background.]()
"I had a hard time finding quality financial models until I came across The Fractional Analyst. Count me in as a lifelong customer!"
Jason Beckstrom - Principal
Beckstrom Company, LLC
-
![Close-up portrait of a man wearing glasses, a blue checked blazer, and a white shirt, smiling against a gray background.]()
"I needed an equity waterfall added to my financial model. The Fractional Analyst team had a good template. I requested a couple tweaks, which they excecuted to my approval, and got the task done in just a few days."
Todd Jensen - SVP Investments
Sila Realty Trust
-
![Silhouette of a man in profile against a glowing blue circle background.]()
"I work in the Data Center development space. Very few know how to build a data center development model. When I engaged The Fractional Analyst, I wasn't exactly sure what to expect. After just 3 weeks (with regular check-ins), I was blown away but what they had put together. I highly recommend their off-the-shelf and custom financial models."
Joseph Strobele - Principal
Crystal Peak Data Centers
-
![Black and white photo of a smiling man with short hair, wearing a collared shirt and jacket.]()
"We didn't have the bandwidth internally to create a financial model, but we desperately needed one. After working with The Fractional Analyst, we got exactly what we needed. Highly recommend!"
James Alfandre - Principal
Urban Alfandre
-
![Close-up of a man with short, slicked-back hair, smiling outdoors with trees in the background.]()
"We work with the good ol' boys in real estate that for some reason are still doing $100M deals in their head. We engaged The Fractional analyst to check our partners' assumptions. We are sure grateful for their work!"
Kirk Walton - Managing Principal
GPWM Funds
-
![A young man in a dark blue pinstripe suit with a white shirt and maroon tie, posing with his arms crossed against a gray background.]()
"I had dozens of deals that I needed underwriting and diligence support on. The Fractional Analyst team stepped up and provided that support."
Tyler Kight - Broker
The Appanage Group
-
![A man in a suit and tie standing in front of shelves with bottles in a store or bar.]()
"I needed two financial feasibility studies done in two totally different markets. The Fractional Analyst team delivered on that request and did a great job, complete with financial models, market research, and stakeholder-ready presentations."
Johnny Vassallo - Founding Principal
MOS RE
-
![White Stone Development Partners logo with gold and black text]()
"We needed a new multifamily acquisition model. We also needed modeling support in our existing development model. The Fractional Analyst team did a great job on both."
Whitestone Development Partners
-
![A man with a beard and short hair, wearing a black t-shirt and a light blue denim shirt, standing outdoors in front of a gray wall.]()
"Our group is headquartered in Toronto and invests into the States. We relied on underwriting and market research support from The Fractional Analyst. Fantastic team!"
Jeff Webb - COO
Made by Gatehouse


FAQ
-
After completing your purchase, you’ll receive an email with a secure download link. You can also access your files anytime through the confirmation page immediately after checkout.
-
Most downloads are provided in Excel (.xlsx), PDF, or PowerPoint (.pptx) formats depending on the product. Each listing specifies the exact formats included.
-
Absolutely. All templates are fully editable and fully unlocked. You can modify formulas, branding, and inputs to fit your project or client deliverable.
-
Your purchase email includes a download link valid for 24 hours. We update these files periodically. If you ever want an updated copy, reach out to us at info@thefractionalanalyst.com for a discount code (80% off current price). We’ll get you taken care of!
-
Due to the nature of the product being sold – digital file downloads – all orders are final. Your satisfaction is our highest priority. Please contact us at info@thefractionalanalyst.com with any comments/concerns. Thank you for your order!
-
Each purchase grants a company-wide license. Please feel free to share the model with your team members and key stakeholders. For anyone asking you for the model, we would ask that you would please send them to our site to purchase their own copy. Thank you for your support, and we look forward to hearing how you use our resources.
-
Our templates are optimized for desktop. Some functions may not work perfectly in Google Sheets or on Mac, though most users find they can still adapt the file with minor adjustments.
-
Yes — we specialize in custom real estate financial models and investment deck design. If you need a model/deck built or adapted for your unique deal structure, visit our On Demand Analyst page or email info@thefractionalanalyst.com
-
We offer 1:1 training for $145/hr. You can reach us at info@thefractionalanalyst.com to set up a call.