
2026 Real Estate Debt Market Outlook
1. Setting the Stage for 2026
The U.S. commercial real estate (CRE) debt market enters 2026 with cautious optimism. After a turbulent 2023–2025 marked by rapid interest rate hikes and tightened credit, the landscape is shifting from rate shock to capital strategy. Borrowers and lenders have adapted to a “higher-for-longer” cost of capital that, while elevated, is becoming more predictable. As we approach 2026, the focus is on strategic capital structuring rather than reacting to rate volatility.
Big Picture Themes:
The Fed Funds Rate was just decreased to 3.75–4.00% SOFR –a welcome sign for borrowing costs but a troubling sign for a weakening labor market. The Federal Reserve’s aggressive 2022–2023 tightening (525 bps of hikes in 18 months, the most in decades according to statista.com) has given way to stability and an expected gradual easing path through 2025.
Credit spreads tightening for high-quality multifamily and industrial loans, as competition returns for lower-risk deals amid improving investor sentiment.
Permanent debt (long-term, fixed-rate loans) resurges via agencies and life companies, which are regaining market share for stabilized assets after the bridge-loan boom of 2021–2022.
Bridge and mezzanine financing adapt with more structure and discipline – lower leverage, more reserves – reflecting lessons learned during the 2023 liquidity crunch.
Liquidity is returning for top-tier sponsors. Well-capitalized borrowers with strong track records are finding lenders increasingly willing to lend, albeit on more conservative terms, as market confidence slowly rebuilds.
2. Market Benchmarks Entering 2026
To benchmark the debt climate, Table 1 summarizes key debt metrics expected in early 2026. These figures represent consensus ranges based on current market quotes and our outlook for Q1 2026:

Table 1: Key debt market metrics entering 2026. MF = multifamily. “Spread” refers to loan yield minus SOFR or Treasuries.
These benchmarks reflect a debt market that has stabilized post-Fed tightening. Short-term rates (SOFR around mid-4%*) remain near cycle highs but are leveling off. Lender spreads, which widened significantly in 2023, are narrowing for core assets as competition picks back up, especially from agency lenders in multifamily and life insurers on prime deals. All-in coupon rates for top-tier loans (e.g. ~6% for life companies) are still high relative to 2020–2021 lows, but borrowers are adjusting to this new normal of debt costs. Underwriting metrics like debt yield (8–9%) and debt service coverage are holding their more conservative post-2022 levels, as lenders maintain discipline even amid improving conditions.
(*Note: The Secured Overnight Financing Rate, SOFR, is the base index for most floating-rate CRE loans. It peaked above 5% in 2023 and is projected around 4.5% by early 2026 under a gradual Fed easing scenario.)
3. A Decade in Review: 2015–2025 CRE Debt Markets
To appreciate the current outlook, it’s important to review the rollercoaster of the past ten years in CRE debt:
2015–2019: Expansion and Record Liquidity. The mid-2010s were characterized by low base rates and abundant capital. Annual U.S. CRE loan originations hovered around $500–600 billion/yr according to urbanland.uli.org, with 2018 marking a then-record ~$574 billion in deal volume according to grs-global.com. Property sales and mortgage originations moved in tandem, peaking in 2019. Ample liquidity from banks, CMBS, and the GSEs (Fannie Mae & Freddie Mac) fueled an era of cheap debt and aggressive pricing. For example, average mortgage spreads for core assets were as low as 150–300 bps in 2018–2019 according to cdn.hl.com, and benchmark rates (Fed funds) were modest (2–2.5% in 2018 sourced by statista.com), resulting in all-in loan coupons often under 5%.
2020: Pandemic Crash. The onset of COVID-19 brought an abrupt halt. Transaction volumes fell roughly 30% in 2020 (greater in many metros) compared to 2019 as markets froze reported by cbre.com. The Fed’s emergency rate cuts to near 0% (SOFR effectively ~0.1% by mid-2020) provided cheap money, but fear and uncertainty led many property owners to delay sales and financings. Total CRE deals in 2020 dropped to the low-$400 billions (vs. ~$600B pre-pandemic) according to cbre.com. Lenders widened spreads dramatically (hundreds of basis points) amid the volatility (cdn.hl.com), and only the highest-quality transactions moved forward.
2021: Remarkable Comeback. By mid-2021, confidence roared back. Investors, armed with stimulus and pent-up capital, went on a buying spree. 2021 transaction volumes nearly doubled 2020’s levels, reaching $809 billion in the U.S.according to cbre.com – about 50% above the 2015–2019 average. This sharp rebound to record volume was aided by rock-bottom interest rates (SOFR ~0.05%) and improved clarity on property performance post-lockdowns. Multifamily and industrial saw especially huge investor demand (more on sector trends below). Mortgage origination hit an all-time high as well, with nearly $900B of new loans in 2021 according to mba.org. Lenders competed vigorously, driving credit spreads back down; by late 2021, financing terms in many cases resembled the pre-COVID environment.
2022: Rising Rates and Peak Market. The tide turned in 2022 as inflation surged and the Fed embarked on its fastest hiking cycle in decades. Between March 2022 and July 2023, the Fed raised short-term rates by 525 bps according to statista.com, pushing SOFR from near zero to ~4.3% by end-2022. Despite the rate shock, 2022 still saw record CRE investment – $1.14 trillion in U.S. transaction volume (resimpli.com), the highest ever. Much of this activity was front-loaded: investors rushed to lock deals before financing costs rose further. However, by Q4 2022, higher debt costs and slowing growth began to cool the market. Lender sentiment shifted cautious, and spreads started widening, anticipating turbulence ahead.
2023: Correction and Credit Crunch. 2023 was a downshift, with many viewing it as a cyclical correction. The combination of 5%+ base rates and economic uncertainty led to a sharp decline in deal activity. U.S. CRE transaction volume fell to about $647 billion for 2023 (resimpli.com) – a 43% drop from 2022’s peak. Debt origination likewise plummeted (2023 lending was ~47% lower than 2022 according to mba.org). All capital sources pulled back: banks tightened lending standards significantly in late 2022 into 2023 (a net 67% of banks were tightening in April 2023 reported by deloitte.com), and the CMBS market saw markedly lower issuance amid volatility. Credit spreads blew out as well – even the safest loans saw 200+ bps wider spreads than a year prior. By mid-2023, the cost of debt for many borrowers had more than doubled year-over-year, pressuring property values downward (cap rates rose ~80 bps on average between mid-2022 and late 2023 according to jpmorgan.com). Notably, borrowers with floating-rate loans felt acute pain: SOFR oscillated around 5.0–5.4% in 2023, its highest level since inception, dramatically increasing interest expenses (tradingeconomics.com). Many had to purchase or extend expensive interest rate caps (the price of a 1-year cap on a $100M loan at a 3% strike jumped to over $2 million in 2023 (globest.com) to maintain lender compliance, adding to cash flow strain.
2024: Inflection and Stabilization. As 2024 unfolded, signs of stabilization emerged. The Fed paused rate hikes, holding Fed funds around 5.25–5.50% (a 22-year according to highpgpf.org). Inflation began cooling toward ~3%, and late in the year banks actually started loosening credit stance – by June 2025 only 9% of banks were still tightening standards, down from 67% a year prior reported by deloitte.com. Transaction volumes in 2024 ticked up modestly from 2023 lows as price expectations between buyers and sellers began to align. However, activity remained well below the 2021 frenzy. Lenders and investors alike recalibrated to the new rate environment. By late 2024, all-in loan rates in the 6–7% range forced deal underwriting to be more conservative (higher debt yields, lower leverage), but the worst of the market imbalance appeared to be over. This sets the stage for 2025 and beyond: a period of adjustment where players focus on strategic financing and asset management rather than chasing ultra-cheap debt.
U.S. commercial real estate transaction volume by year (2015–2023). After peaking in 2021–2022, volume fell sharply in 2023 according to resimpli.com. Sources: MBA, RCA, CBRE.
In summary, the 2015–2025 decade saw boom, bust, and recovery. Record-low interest rates in the late 2010s and again in 2020–21 gave way to the fastest rate spike in a generation by 2023, testing the resilience of CRE debt markets. As we head into 2026, many of the excesses (high leverage, low rates) of the last cycle have been unwound, leaving a market that is more disciplined and price-adjusted, albeit with higher baseline financing costs than borrowers grew accustomed to in the 2010s.
4. CRE Transaction Volume Trends by Sector (2015–2025)
Drilling down, different property sectors followed unique trajectories over the past decade. A few key trends stand out:
Multifamily – The Volume Leader: Apartments have been the favored asset class for much of the past ten years. Multifamily’s share of total investment grew from about one-third in the mid-2010s to around 40%+ in recent years according to cbre.com. In 2021, multifamily saw 43% of all CRE investment – its highest share on record – reflecting enormous capital inflows into the sector. Even in 2023’s downturn, agency lenders (Fannie Mae and Freddie Mac) continued to provide liquidity for multifamily, and many investors view rental housing’s long-term demand as a safe bet. The result: multifamily transaction volumes were relatively resilient in 2023 (estimated ~$264B in lending, still the highest of any property type) according to mba.org. Going into 2026, multifamily remains the primary target for debt and equity capital, supported by solid fundamentals (housing shortage, high rents) – albeit with regional variations.
Industrial – From Niche to Core: A decade ago, industrial (warehouses, logistics facilities) was a smaller piece of the pie; but the e-commerce boom changed that. Industrial investment volumes steadily climbed, and by 2019 industrial was firmly a core sector. In 2020, amid a surge in online retail, industrial transaction volume actually hit a record 26% of total CRE – even as other sectors slowed according to cbre.com. Investors flocked to distribution centers and logistics properties, driving yields to record lows. Post-pandemic, industrial remains highly sought-after, though 2023 brought a slight cooldown (higher interest rates have tempered the formerly red-hot price growth for warehouses). For 2026, the outlook is for continued strong demand for industrial assets, supported by supply chain reconfiguration and onshoring trends. Lenders view industrial loans favorably due to historically low default rates in the sector.
Office – Facing Headwinds: The office sector has seen perhaps the most profound shift. In the mid-2010s, office properties comprised roughly 25–30% of investment volume (cbre.com). But even before COVID, secular trends (remote work, tech-driven space efficiency) were challenging office demand. The pandemic then accelerated remote/hybrid work, leading to higher vacancies and uncertainty. By 2021, office’s share of CRE investment had fallen to just 18%cbre.com. Office transaction volume in 2023 was anemic – many investors stayed on the sidelines as values were difficult to pin down and lenders dramatically tightened credit for office deals. Some office assets (especially older buildings in weak markets) have seen steep value declines and distress. Going into 2026, office remains the problem child of CRE. Lenders are demanding very conservative terms (low leverage, high debt yields ~10%+) for office loans, if they lend at all. Any recovery likely hinges on employers’ return-to-office plans and adaptive re-use trends to absorb excess space.
Retail – Stabilizing after E-Commerce Shock: Retail real estate (shopping centers, malls) underwent a structural correction in the late 2010s due to e-commerce. Retail’s share of investment dropped to ~11% by 2019 according to cbre.com. The pandemic dealt another blow, but interestingly, parts of the retail sector have rebounded as consumer behavior normalized. Essential retail (grocery-anchored centers) and well-located strip centers have recovered investor interest. By 2023, retail transaction volumes had stabilized at lower levels, focusing on open-air centers and discount retail – while regional malls continue to struggle. Lenders in 2026 are selectively open to retail loans, favoring necessity-based centers with strong tenant sales. Credit spreads for retail loans remain wider than for multifamily/industrial, reflecting perceived risk, but the sector is no longer in freefall and cap rates have adjusted upward to attract buyers.
Hotel & Others – Volatile but Rebounding: The hospitality sector was hit hard in 2020 (hotel investment share fell to 3% reported by cbre.com) and then enjoyed a bounce in 2021–2022 as travel resumed (hotel investment back up to ~6% of volume in 2021 according to cbre.com). Hotel performance tends to track the economy closely, so the sector saw a solid recovery through 2022, then a moderation in 2023 alongside slower economic growth. Lenders view hotels as higher-risk, short-lease assets; consequently, hotel loans in 2023–25 often carried hefty interest rates or required mortgage REITs/debt funds to step in. Other specialized sectors – e.g. data centers, student housing, life sciences labs – have garnered increasing attention and capital allocation in recent years (the so-called “alternative” sectors). These niches often have favorable demand drivers (like data consumption or biotech growth) that make them attractive despite requiring specialized lending expertise.
Overall, sector trends underscore a key theme: capital has concentrated in what are perceived as the most resilient sectors (multifamily, industrial), especially during uncertain times, while pulling back from sectors facing structural challenges (office, some retail). As 2026 approaches, this divergence is expected to persist. Multifamily and industrial cap rates are starting to compress again due to competition, whereas office cap rates/values are under continued pressure, and lenders accordingly allocate credit selectively. Successful borrowers will need to understand these sector dynamics and position their assets and financing strategies to align with where capital is flowing.
5. The Shifting Interest Rate Environment
A centerpiece of any debt market outlook is the interest rate trajectory. The past few years have been extraordinary on this front. Figure 1 below shows the history of short-term benchmark rates (SOFR) on a monthly basis from 2016 through 2025, illustrating the dramatic swings:
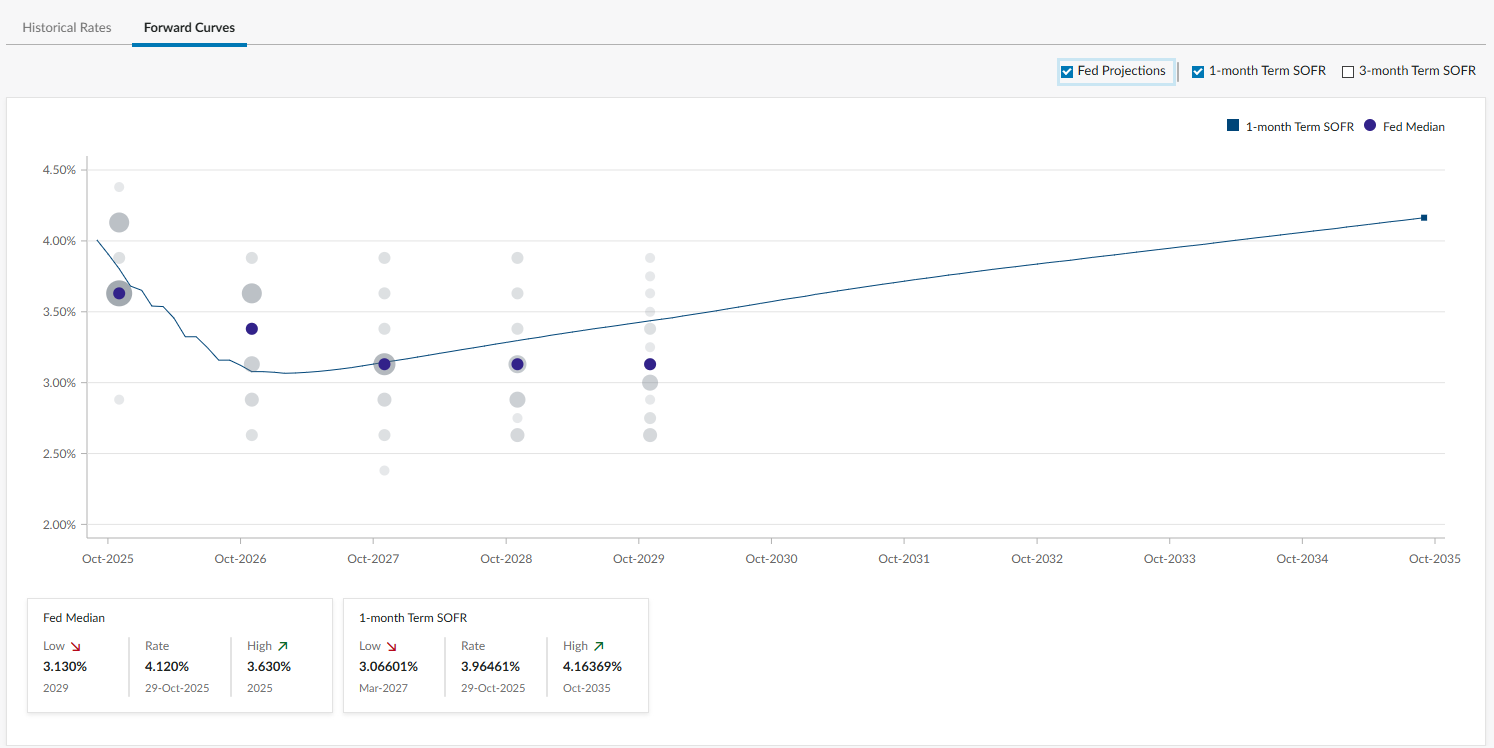
Figure 1: Monthly SOFR history, 2016–2025. SOFR remained near zero for much of 2016–2017, climbed to ~2.5% by 2018–2019, then dropped to 0% in 2020. The Fed’s rapid tightening in 2022–2023 sent SOFR above 5%, a multi-decade high – thestreet.com & tradingeconomics.com.
Rate Trends: In 2016–2019 the Secured Overnight Financing Rate averaged around 1–2%, reflecting the gently rising Fed funds target (which peaked at 2.5% in late 2018) according to statista.com. The COVID crisis prompted an immediate return to 0% interest rates – SOFR hovered at ~0.1% for nearly two years (2020–2021) as the Fed fought to support the economy. But by 2022, with inflation at 40-year highs, the Fed executed an unprecedented series of rate hikes. SOFR rocketed from effectively 0% in early 2022 to about 5.3% by mid-2023, its highest level since SOFR’s introduction according to tradingeconomics.com (and indeed the highest U.S. overnight rate in ~22 years reported by pgpf.org). This rapid tightening dramatically increased debt service costs: A loan that in 2021 carried a 3% interest rate might carry 7.5% by 2023 (e.g. 5.3% SOFR + 2.2% credit spread).
By late 2023 into 2024, however, the situation stabilized. The Fed shifted to a holding pattern, and SOFR leveled off in the 5.0–5.3% range. Importantly, markets began to anticipate future rate cuts as inflation showed signs of cooling. Forward curves as of late 2024 implied that the Fed might start modest easing in 2025, potentially bringing short-term rates down to ~3.5%–4% by end of 2025. Indeed, our base case for 2026 assumes a gentle decline in benchmark rates: we expect 1-month SOFR to sit in the mid-4% range in early 2026, drifting slightly lower as the Fed cautiously reduces rates toward a neutral level. This outlook aligns with various forecasts – for instance, CBRE Econometric Advisors forecast the fed funds rate falling to ~2% by 2025 in an upside scenario according to cbre.com, though our view is a bit more conservative.
Implications for Borrowers: A plateauing (or slowly falling) base rate is welcome news for borrowers after the volatility of 2022–2023. It means predictability is returning. Borrowers can budget for debt service with more confidence that base rates won’t spike further. Many are opting to lock in fixed-rate debt in late 2025, sensing that we are near the peak of the rate cycle. Those still using floating-rate loans have seen some relief in the pricing of interest rate caps – which had exploded in cost during 2022–23’s volatility. (For example, the cost of a 3-year cap with a 4.5% strike was nearly $1 million in 2023 for a $50M loan according to chathamfinancial.com, versus only a fraction of that pre-2022. As of late 2025, cap prices have begun to ebb slightly as the forward curve flattened and volatility abated.) Borrowers should still budget for elevated cap costs in 2026, but if the Fed indeed starts cutting, cap premiums and swap rates are likely to decline, easing the expense of hedging floating loans.
Lending Spreads: The rate environment also feeds into credit spreads. During the zero-rate years, spreads compressed since lenders were chasing yield. In 2022–2023, as base rates jumped, lenders initially widened spreads (both to manage risk and because fewer competitors were active). At the height of the 2023 turmoil, even conservatively underwritten loans saw spreads 50–100 bps higher than pre-pandemic norms, and riskier bridge loans often carried 400+ bps spreads over SOFR. However, as we move through 2025, a clear trend of spread tightening has emerged, especially for favored asset classes. Agency lenders, for instance, have lowered spreads for top-tier multifamily loans (down to ~160 bps over SOFR in some cases, from 200+ bps in 2023) as their loan pipelines fill up again. Life insurance companies, flush with allocations to deploy, are quoting very competitive fixed-rate coupons (often under 6% for low-leverage institutional assets, which implies spreads that are back in the ~150 bps range given current swap rates). Even some banks and debt funds, eager to book business after a slow year, have trimmed their loan spreads by a quarter-point or more from the widest levels.
That said, credit conditions remain bifurcated. Higher-risk situations (e.g. leasing-up office buildings or heavy repositioning projects) still face a high cost of capital or limited availability. But for stabilized, high-quality assets, lenders are competing again, and borrowers can expect marginally better pricing and terms in 2026 than they saw at the start of 2024. The overall financing environment in 2026 can be described as stable but selective: interest rates are no longer a moving target every week, and while debt is not cheap, it is available for the right deals.
6. Lender Landscape and Loan Origination by Source
The CRE debt market is supported by a variety of capital sources – each with different appetites and strategies. Recent shifts in the lender landscape are shaping who is active (or inactive) in 2026:
Banks and Depositories: Commercial banks (including regional and community banks) historically form the backbone of CRE lending. As of Q1 2024, banks held about 38% of all outstanding commercial mortgage debt – the largest share among lender groups according to cdn.hl.com. In origination terms, banks often account for roughly one-third of new loan volumes in strong years. For example, in 2018 banks provided about 30% of CRE loan originations reported by grs-global.com. In 2023, however, banks pulled back significantly due to higher rates and regulatory pressure. By April 2023, 67% of banks reported tightening credit standards (deloitte.com). This retrenchment was a major factor in the 2023 lending slump. Moving into 2026, bank lending is cautiously re-emerging. Bank credit teams are focusing on relationship borrowers and lower-risk loans (think: refinancing of existing customers, loans on stabilized multifamily or industrial assets with strong sponsors). The worst of the regional bank turmoil (early 2023) has passed, but banks face capital constraints that keep them more conservative than in the last expansion. Expect banks to remain selective, offering attractive rates for moderate leverage deals (up to ~60% LTV) but often passing on highly leveraged or speculative business plans.
Government-Sponsored Enterprises (GSEs): Agency lenders (Fannie Mae, Freddie Mac, and FHA) have been a stalwart in the multifamily lending arena. In 2022–2023, as private capital pulled back, the GSEs increased their relative share of lending – providing critical liquidity to the apartment sector. In 2016, housing agencies accounted for about 22% of total CRE originations according to urbanland.uli.org; in recent years, their market share has grown during downturns (for instance, agency volume was one of the few bright spots in 2023). The GSEs have annual lending caps (around $100B+ each currently), and in 2024 they actually had room to spare, prompting competitive pricing on loans that qualify as “mission-driven” (affordable, green, etc.). For 2026, agencies are expected to remain very active, likely originating $140–160B combined in multifamily loans if transaction activity continues to firm up. Agency spreads have been tightening – currently in the mid-100s over SOFR for top deals. Borrowers should take note: the agencies prefer high-quality multifamily with stabilized cash flow (or light value-add with strong sponsorship). They are less likely to finance other property types, so their abundance of capital mainly benefits the apartment sector.
Life Insurance Companies and Pensions: Life insurers have long been conservative CRE lenders, cherry-picking the lowest-risk loans (typically <60% LTV on high-quality assets). They hold roughly 15% of outstanding CRE mortgage debt and in 2023 were the second-largest source of new loan commitments after banks (mba.org). In 2018, life cos provided ~15% of originations according to grs-global.com; in 2023 their share likely rose as banks and CMBS pulled back. Lifecos are entering 2026 in a strong position: their allocations to CRE debt are replenished and they are actively quoting loans. Borrowers with core assets (especially office, retail, or industrial assets with strong tenants) find life companies offering some of the best pricing – often a fixed-rate loan in the high-5% range for 10-year money. Life insurers are also known for being steady when others pull back. In 2023, they continued lending (albeit at higher rates) when the CMBS market froze. Expect life companies in 2026 to finance a significant volume of refinancing deals for quality assets coming due. They generally won’t stretch on leverage or fund transitional properties, but for the deals that fit, lifecos are a dependable and competitively priced capital source.
CMBS and Securitization: Private-label Commercial Mortgage-Backed Securities had a tough go in the recent volatility. CMBS lenders contributed about 15–20% of CRE debt in the late 2010s according to grs-global.com (CMBS was 16% of 2016 originations, equal to life company share reported by urbanland.uli.org). However, rising interest rates and credit spreads in 2022–2023 severely impacted CMBS issuance – 2023 volume was down dramatically from 2021 levels, as many deals became uneconomical to securitize. As we head into 2026, the CMBS market is slowly thawing. Bond investors are finding value in higher-yield CMBS bonds, and spreads have tightened from their widest point in 2022. We anticipate a moderate uptick in CMBS conduit lending in 2026, focusing on loans for which no other outlet exists (often secondary market retail or office, moderate leverage, pooled for diversification). Conduit loans will still carry relatively high interest rates (the lender must price in the CMBS bond spread, which for BBB- tranches remains high). Borrowers should not expect 2019-era CMBS pricing, but the market’s reopening is a positive sign for liquidity. Additionally, agency CMBS (securitization of multifamily agency loans) will continue strong, given the agencies’ activity.
Debt Funds and Private Credit “Debt Capital”: So-called “investor-driven lenders” (debt funds, mortgage REITs, private equity funds) became very prominent in the last decade, especially for bridge loans and construction financing. These non-bank lenders often have higher cost capital and fill riskier roles (mezzanine pieces, preferred equity, etc.). In 2023, debt funds took a step back due to uncertainty and the high cost of their own capital (many debt funds themselves borrow warehouse lines that became expensive with SOFR at 5%+). Still, they remained a necessary piece of the puzzle, stepping in where banks feared to tread. According to MBA, investor-driven lenders (debt funds) were one of the smaller but still crucial sources in 2023, behind banks, lifecos, GSEs, and CMBS according to mba.org. Looking to 2026, private debt capital is revving up again – many funds have raised new pools (there is substantial “dry powder,” with global real estate private debt fundraising robust through early 2025 shared by deloitte.com). These lenders are targeting opportunities in refinancing maturing loans that banks won’t extend, financing value-add acquisitions, and providing mezzanine loans to stack on bank senior loans (creating a blended capital stack for borrowers). Borrowers in 2026 can expect debt fund loans to carry higher spreads than bank loans (often 300–500 bps over SOFR for bridge financing, depending on leverage). However, debt funds offer flexibility and creative structuring. As long as real estate fundamentals don’t deteriorate severely, this cohort is positioned to increase market share by solving financing gaps – albeit at a price.
Lender Competition and Outlook: In summary, all major lender groups are cautiously re-entering the fray by 2026, after a period in which many “hit the brakes.” Depository banks remain the largest source of CRE debt by volume, but with a tighter credit box. Agencies dominate multifamily and will likely hit near-record lending volumes given supportive housing policy and borrower demand. Life companies provide the cheapest rates for low-risk deals and will be highly active in refinancing scenarios. CMBS is recovering but will stay limited until spreads tighten further. Debt funds and other private lenders are opportunistically filling higher-risk or quick-close financings, with plenty of capital to deploy (especially in the mezz/pref equity space where they expect attractive returns).
Crucially, the worst-case fears of a full-blown credit crunch in CRE have not materialized beyond the office sector. Banks tightening in 2023 certainly caused pain, but other lenders stepped in to prevent a complete freeze. By mid-2025, the reduced tightening (and even easing) of lending standards reported by deloitte.com is a reliable precursor to improved debt availability. We anticipate 2026 will see improved loan origination volumes across the board – potentially a double-digit percentage increase from 2024 levels according to mba.org if macro conditions remain benign – as lenders regain confidence and adapt to the higher-rate environment.
7. 2026 Outlook: Rates, Spreads, and Credit Availability
Bringing together the rate and lender dynamics discussed, what should market participants expect in 2026 in terms of cost of capital and financing conditions?
Base Interest Rates: As noted, our base expectation is for mild relief on base rates. The Fed is likely to cut rates gradually (25 bps at a time) starting mid-2025, barring any resurgence of inflation. Thus by 2026, 1-month SOFR could edge down to the mid-4% range. This is still far above the near-zero levels of early 2020s, but about 100 bps lower than the 5.5% peak of 2023. Such an easing would directly lower all floating-rate loan coupons and indirectly help fixed-rate loans via lower Treasury yields. Borrowers should not bank on a return to ultra-low rates – “higher for longer” remains the prudent planning stance – but 2026 should see somewhat lower interest expense than 2024–2025 did, providing breathing room especially for assets that narrowly covered debt service at the peak rates.
Lending Spreads and Loan Pricing: With more lenders competing again, credit spreads are forecast to compress modestly. We expect spreads on permanent loans for multifamily and industrial to tighten by another 20–30 bps in 2026, given strong lender interest in those sectors. For example, agency multifamily loan spreads that were ~1.80% in 2024 could average ~1.60% in 2026 if liquidity remains abundant. Life company loan coupons (spread + Treasury) will remain in the 5.75–6.25% range for prime properties, making them among the most attractive options. Even riskier bridge loans should see some price improvement: debt fund competition and stabilizing markets may push bridge loan spreads down to say ~3.00% over SOFR (from 3.50%+) for moderate leverage deals. Refinance challenges will persist for some, but many loans made in 2020–21 at 3–4% rates have already been restructured or extended; the next wave of maturities in 2026–27 will face rates in the 5–7% range, which is tough but hopefully offset by income growth and lender flexibility. All told, borrowers in 2026 can expect slightly better loan terms than the last two years – not a borrower’s market by any means, but a gradual shift back toward normalcy with lower spreads and improved credit availability.
Credit Availability: Perhaps the biggest question mark is, will lenders actually lend? The outlook here is improving. As noted, bank regulators’ stance has softened from strict tightening to a more neutral view as systemic risks have easeddeloitte.com. A huge wall of loan maturities (over $900B in 2024–2025) forced many extensions and modifications, but by 2026 some of that overhang will be resolved, allowing lenders to focus on new opportunities. We anticipate credit availability will increase in 2026 – more lenders are actively seeking deals, and capital that sat on the sidelines is being pressured to generate returns. One evidence point: Global real estate “dry powder” (undeployed capital) remains high at ~$380B according to resimpli.com, and much of that could enter debt or equity deals as confidence returns. That said, underwriting will remain prudent. Lenders will still require conservative leverage (on average, 55–65% LTV for permanent loans, lower for risky assets) and solid debt service coverage (often needing 1.3x+ DSCR at the underwritten rate). They are also more stringent on structure – requiring interest reserves, quicker cash sweep triggers, etc., in case performance falters. But compared to the near credit freeze of late 2022, the 2026 environment should feel far more fluid. Borrowers with solid projects and reasonable requests are likely to find lenders willing to transact.
Borrower Strategy – Offense vs Defense: With rates stabilizing and lenders re-entering the market, 2026 may mark a turn from defense to offense for some borrowers. In 2023–24 many owners were in triage mode (extending loans, cutting costs, holding off investments). In 2026, those who positioned well could go on the offensive – acquiring assets at corrected prices with the help of newly available financing. Value-add investors, in particular, might see opportunity: debt funds and banks are cautiously re-emerging to fund renovations and re-leasing projects (though likely at lower leverage than in 2019). For borrowers still facing challenges – e.g. an office landlord with a loan coming due – 2026’s slightly better rates and credit conditions improve the odds of a workout or refinance rather than a foreclosure. Lenders have shown willingness to extend and amend if the asset has viable economics, and this cooperative stance should persist as long as the economy avoids a severe downturn. In short, borrowing in 2026 will still require discipline, but the playing field is more stable. Those who proactively locked in longer-term debt in 2021–22 might even consider refinancing in late 2025 or 2026 if the rate reductions materialize, to capture a lower coupon or pull some cash out (subject to prepayment economics). Meanwhile, borrowers who weathered the storm with floating-rate debt should prioritize reducing rate exposure – either by refinancing to fixed rates or securing caps – to guard against any surprises.
8. Key Considerations for Borrowers and Brokers in 2026
In the evolving 2026 landscape, borrowers and mortgage brokers should keep several strategic considerations in mind:
“Higher-for-Longer” Baseline: Even with potential Fed cuts, plan for SOFR to stay elevated around ~4–4.5% through 2026 as a working assumption. Underwriting deals with a base rate that only drifts down modestly (rather than collapsing) will ensure more resilient project economics. If rates fall more, that’s upside – but don’t count on cheap money returning. In practice, this means using a relatively high going-in debt constant when evaluating acquisitions or refinances.
Conservative Leverage and Ample Buffers: Maintain conservative leverage levels and build in liquidity cushions. Loan-to-value (LTV) ratios in the 55–65% range (or debt yields of 8–9%+) are the new normal – pushing higher will either be impossible or very costly. Borrowers should bring additional equity if needed to keep leverage in check. Likewise, establish cash reserves or lines of credit as interest and operating buffers. With less margin for error in today’s financing, deals should be structured to withstand delays, lease-up shortfalls, or interest rate surprises.
Flexible, Multi-Layered Capital Stacks: Structure your capital stack creatively, using multiple layers if necessary. In 2026, a single senior loan may not get you to the desired leverage – but pairing a first mortgage with mezzanine debt or preferred equity could bridge the gap. Be prepared to engage mez lenders or equity partners to complete funding. Also, seek loans with structure that provides flexibility (e.g. extension options, earn-outs for performance) so that if business plans take longer, you have built-in solutions. Flexibility extends to loan covenants: negotiate reasonable DSCR cash sweep triggers, etc., to avoid undue cash traps if performance dips temporarily.
Interest Rate Hedge Strategy: Reevaluate your interest rate hedging approach. If using floating-rate debt, budget for rate cap costs and factor them into your returns (these costs skyrocketed as rates rosefrostbrowntodd.com, and while they may ease with lower volatility, they remain significant). Consider longer tenor caps or swaps to lock in forward rates if you believe cuts are coming – mid-2025 might present an opportunity to hedge at a relative peak in rates. For fixed-rate debt, mind the yield curve: if long-term rates drop more than short-term, you might secure a long-term loan at an attractive rate relative to floating. Work closely with finance brokers or derivatives desks to time any hedges or refinances with market movements.
Underwriting Assumptions & Valuations: Underwrite income and exit values conservatively. Lenders in 2026 will scrutinize appraisal assumptions, rent growth projections, and cap rates. Use higher exit cap rates in your models (50–100 bps above entry cap in many cases) to be safe, given cap rates expanded in 2022–2024 and may only compress modestly in 2026 for certain sectorsjpmorgan.com. Also, underwrite rent growth and occupancy with caution – while many markets are rebounding, economic uncertainties (or a mild recession) could temper fundamentals. By building a deal that “works” under conservative assumptions, you increase the likelihood of obtaining financing and enduring any speed bumps.
Leverage Tech and Data: In an environment where lender caution is still high, borrowers should use data and technology to bolster their credibility. Come to the table with detailed market analysis, tenant credit information, and stress-tested financials. Demonstrating sophisticated asset management (e.g. using proptech for efficiency, providing real-time performance data) can set you apart with lenders. Brokers, too, should harness up-to-date market data to advocate for clients – whether that’s recent comp sets to support valuations or analytics that show a property’s resilience. In essence, better information and transparency can help convince a lender to proceed, even on a challenging deal.
Relationships and Execution: Finally, relationships matter more than ever in 2026. Banks are prioritizing loyal existing clients; life companies and funds are giving the best terms to sponsors they trust. Borrowers should lean into their relationships or work with intermediaries who have strong lender networks. Deals may take longer to get approved in this environment, so start the process early and be responsive to information requests. Having a reputation for execution and integrity can genuinely save you cost (maybe a lender shaves 10 bps off the spread for a known quantity) and time. Brokers should curate lender lists carefully, matching the right lender to each deal’s profile to streamline execution.
In summary, preparation and prudence are the watchwords for 2026. The market is improving, but not back to easy money. Those who adapt their strategies – by locking in sustainable financing, structuring deals smartly, and rigorously underwriting – will position themselves to not only survive but take advantage of the opportunities in this phase of the real estate cycle.
9. Scenario Outlook: 2026–2027 Base, Bull, Bear Cases
It’s useful to consider multiple scenarios for the next 24 months, given uncertainties around the economy and policy. Below is a scenario matrix outlining a Base Case, Bull Case, and Bear Case for the CRE debt market in 2026–2027:

Our Base Case envisions a “soft landing” where the economy grows slowly, inflation is tamed, and the Fed eases gently. This scenario is essentially a continuation of current trends – favorable for a gradual healing of CRE finance.
The Bull Case imagines a better-than-expected outcome: inflation falls without requiring high rates, or the Fed finds room to cut quickly, and the economy remains solid. This would recreate conditions akin to the mid-2010s: ample credit, low interest, and likely a surge in values as investors chase yield (though this time starting from higher cap rates, so upside in values could be significant).
The Bear Case captures two potential negatives – either stubborn inflation (hence sustained high rates and high costs) or a significant recession (which might bring rates down but cause income stress and lender risk-aversion). Either variant of Bear would put borrowers in a tough spot: refinancing would be difficult, valuations would be under pressure, and some owners would face loan defaults or the need to inject cash.
Importantly, as of late 2025, the base case appears most likely, with some upside leanings – many indicators (inflation rates, bank lending surveys, etc.) suggest improvement according to deloitte.com. However, prudent strategizing means preparing for the Bear Case (ensure resilience) while being ready to act if the Bull Case unfolds (take advantage of the good times).
10. Conclusion
The 2026 real estate debt market is poised at an inflection point. After weathering the storm of rising rates and tightened credit, borrowers and lenders are stepping into a more stable – if still cautious – financing environment. Opportunities and risks coexist: Borrowers who navigate with discipline – conserving cash, locking favorable terms when available, and leveraging relationships – will find that capital is available for sound projects. Lenders, for their part, are regaining appetite but remain choosy, rewarding quality and penalizing weakness.
In this “new normal” of mid-single-digit interest rates and measured underwriting, success will depend on strategic planning and adaptability. By learning the lessons of the past decade and keeping an eye on economic signals, market participants can confidently chart their course. The outlook for 2026 is one of guarded optimism – with the debt markets likely to play a supportive (if not exuberant) role in the CRE industry’s next chapter.
Sources
Mortgage Bankers Association – 2023 Commercial Real Estate/Multifamily Finance Annual Origination Volume Summation (Jamie Woodwell comments) — mba.org.
Urban Land Institute (ULI) – Mortgage Originations Decline in 2016 (O. Mandzy) — urbanland.uli.org.
GRS Group – 2018 Breaks Origination Records (MBA Survey via Trepp) — grs-global.com.
Federal Reserve – Historical Proxies for SOFR (Bowman, 2019) — federalreserve.gov.
Trading Economics – United States SOFR Rate (data snapshot) — tradingeconomics.com.
Deloitte – 2026 Commercial Real Estate Outlook (Bank lending standards) — deloitte.com.
Mortgage Bankers Association – Press Release Apr 23, 2024 (2023 volume and capital sources) — mba.org.
REsimpli – Commercial Real Estate Statistics 2025 (2022 & 2023 transaction volumes) — resimpli.com.
CBRE EA – Steady Investment Activity Shows CRE Resilience (2021 volumes and sector shares) — cbre.com.
Houlihan Lokey – CRE Debt Market Update Oct 2024 (Market share and spreads) — cdn.hl.com.
Frost Brown Todd – Rising Rates & Interest Rate Caps (cap cost impacts) — frostbrowntodd.com.
Statista/WSJ – Fed Tightening Cycle 2022–23 (525 bps hikes, 22-year high rates) — statista.com & pgpf.org.
This update synthesizes publicly available reporting; local submarket conditions may vary.
Citations
2026_Real_Estate_Debt_Market_Outlook_v3.pdf
file://file_00000000593062099f6a4f723bfba70f
Chart: The Most Aggressive Tightening Cycle in Decades | Statista
2026_Real_Estate_Debt_Market_Outlook_v3.pdf
file://file_00000000593062099f6a4f723bfba70f
2026_Real_Estate_Debt_Market_Outlook_v3.pdf
file://file_00000000593062099f6a4f723bfba70f
2026_Real_Estate_Debt_Market_Outlook_v3.pdf
file://file_00000000593062099f6a4f723bfba70f
2026_Real_Estate_Debt_Market_Outlook_v3.pdf
file://file_00000000593062099f6a4f723bfba70f
2026_Real_Estate_Debt_Market_Outlook_v3.pdf
file://file_00000000593062099f6a4f723bfba70f
Mortgage Originations Decline in 2016 as Sales Volumes Also Dip - Urban Land Magazine
https://urbanland.uli.org/capital-markets/originations-decline-2016-sales-volumes-also-dip
MBA Survey: 2018 Breaks Mortgage-Origination Records - GRS Group
https://grs-global.com/2019/08/mba-survey-2018-breaks-mortgage-origination-records/
Commercial Real Estate- Debt Market Update October 2024
https://cdn.hl.com/pdf/2024/cre-debt-market-update-oct-2024.pdf
Chart: The Most Aggressive Tightening Cycle in Decades | Statista
Steady Investment Activity Shows Commercial Real Estate Resilience | CBRE
Commercial Real Estate- Debt Market Update October 2024
https://cdn.hl.com/pdf/2024/cre-debt-market-update-oct-2024.pdf
Total Commercial Real Estate Borrowing and Lending Declined 47 Percent in 2023 | MBA
80+ Commercial Real Estate Statistics in 2025
https://resimpli.com/blog/commercial-real-estate-statistics/
2026 commercial real estate outlook | Deloitte Insights
The role of cap rates in real estate - J.P. Morgan
https://www.jpmorgan.com/insights/real-estate/commercial-term-lending/cap-rates-explained
United States Secured Overnight Financing Rate (SOFR)
https://tradingeconomics.com/united-states/secured-overnight-financing-rate
Interest Rate Cap Costs Are Surging Again - Globest
https://www.globest.com/2024/05/07/interest-rate-cap-costs-are-surging-again/
The Fed Reduced the Short-Term Rate, but Interest Costs Remain ...
https://www.pgpf.org/article/higher-interest-rates-will-raise-interest-costs-on-the-national-debt/
Steady Investment Activity Shows Commercial Real Estate Resilience | CBRE
Total Commercial Real Estate Borrowing and Lending Declined 47 Percent in 2023 | MBA
Steady Investment Activity Shows Commercial Real Estate Resilience | CBRE
Steady Investment Activity Shows Commercial Real Estate Resilience | CBRE
Steady Investment Activity Shows Commercial Real Estate Resilience | CBRE
Steady Investment Activity Shows Commercial Real Estate Resilience | CBRE
A timeline of the Fed's '22–'23 rate hikes & what caused them
https://www.thestreet.com/fed/fed-rate-hikes-2022-2023-timeline-discussion
Cap Rate Expansion Likely to Continue But May Peak Later in 2023 ...
“Springing” Interest Rate Cap Requirements in CRE Loans
https://www.chathamfinancial.com/insights/springing-interest-rate-cap-requirements-in-cre-loans
2026_Real_Estate_Debt_Market_Outlook_v3.pdf
file://file_00000000593062099f6a4f723bfba70f
Commercial Real Estate- Debt Market Update October 2024
https://cdn.hl.com/pdf/2024/cre-debt-market-update-oct-2024.pdf
MBA Survey: 2018 Breaks Mortgage-Origination Records - GRS Group
https://grs-global.com/2019/08/mba-survey-2018-breaks-mortgage-origination-records/
Mortgage Originations Decline in 2016 as Sales Volumes Also Dip - Urban Land Magazine
https://urbanland.uli.org/capital-markets/originations-decline-2016-sales-volumes-also-dip
Total Commercial Real Estate Borrowing and Lending Declined 47 Percent in 2023 | MBA
2026 commercial real estate outlook | Deloitte Insights
Total Commercial Real Estate Borrowing and Lending Increased 16 ...
2026_Real_Estate_Debt_Market_Outlook_v3.pdf
file://file_00000000593062099f6a4f723bfba70f
80+ Commercial Real Estate Statistics in 2025
https://resimpli.com/blog/commercial-real-estate-statistics/
2026_Real_Estate_Debt_Market_Outlook_v3.pdf
file://file_00000000593062099f6a4f723bfba70f
2026_Real_Estate_Debt_Market_Outlook_v3.pdf
file://file_00000000593062099f6a4f723bfba70f
Rapidly Rising Rates Complicate Existing Floating… | Frost Brown Todd
https://frostbrowntodd.com/rapidly-rising-rates-complicate-existing-floating-rate-loans/
The Fed - Historical Proxies for the Secured Overnight Financing Rate
The Fed - Historical Proxies for the Secured Overnight Financing Rate
Total Commercial Real Estate Borrowing and Lending Declined 47 Percent in 2023 | MBA