
Commercial Real Estate (CRE) Outlook 2026–2030: Sector‑By‑Sector Forecast & Investment Playbook
Table of Contents
Introduction: Why 2026–2030 Matters for Commercial Real Estate
The Macro Forces Reshaping CRE Across All Sectors
Interest Rates & Refinancing Dynamics
Trade Policy, Tariffs & Supply Chains
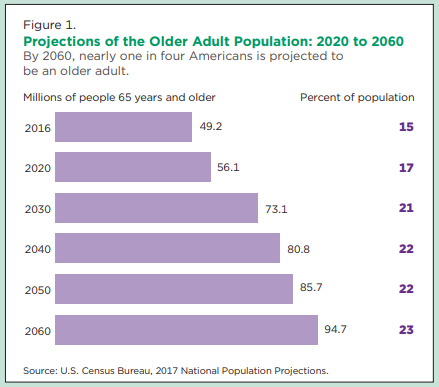
Demographics, Household Formation & Migration
Local Regulation & Housing Policy
Multifamily Real Estate Outlook
Market Fundamentals: 2026–2030
Drivers, Winners & Risks
Build‑to‑Rent (BTR): A Structural Growth Story
Demand Drivers & Investment Themes
Sector Risks and Strategic Advantages
Retail Real Estate: Polarization & Resilience
Winners in Retail & Consumer Dynamics
Retail Risks in a Changing Landscape
Office Sector: A Tale of Two Markets
Vacancy Trends, Conversions & Distress
Strategic Positioning for Offices
Industrial Property: Modern Logistics & Trade Flows
Sector Resurgence with Nearshoring & Automation
Industrial Challenges & Strategic Site Selection
Hospitality Outlook: Choppy but Investable
Scattered‑Site SFR Portfolios: Fragmented, Yet Growing
Self Storage: Data‑Driven and Locally Sensitive
How Lenders and Investors Should Position for 2026–2030
Conclusion: CRE in Transition — Where to Focus for Long‑Term Gains
1. Introduction: Why 2026–2030 Matters for Commercial Real Estate
The commercial real estate market is entering a pivotal five‑year window (2026–2030) shaped by evolving macroeconomic forces, demographic trends, policy change, and sector‑specific dynamics. After a turbulent lending and transaction cycle in the early 2020s — driven by rate volatility and refinancing pressures — the next half‑decade is likely to be one of normalization, strategic repositioning, and structural realignment.
Investors, lenders, developers, and operating partners must grasp the sector‑by‑sector nuances from multifamily to industrial, retail to hospitality, and everything in between. Understanding where demand will concentrate, where risk will persist, and where policy impact will be greatest is critical for disciplined underwriting and strategic capital allocation.
This blog post provides a comprehensive CRE outlook through 2030, paired with practical recommendations for stakeholders positioning for the next cycle.
Primary SEO Keywords: commercial real estate outlook, CRE trends 2026–2030, CRE sector forecast, multifamily outlook, build‑to‑rent growth, retail real estate trends, office market transformation, industrial real estate demand.
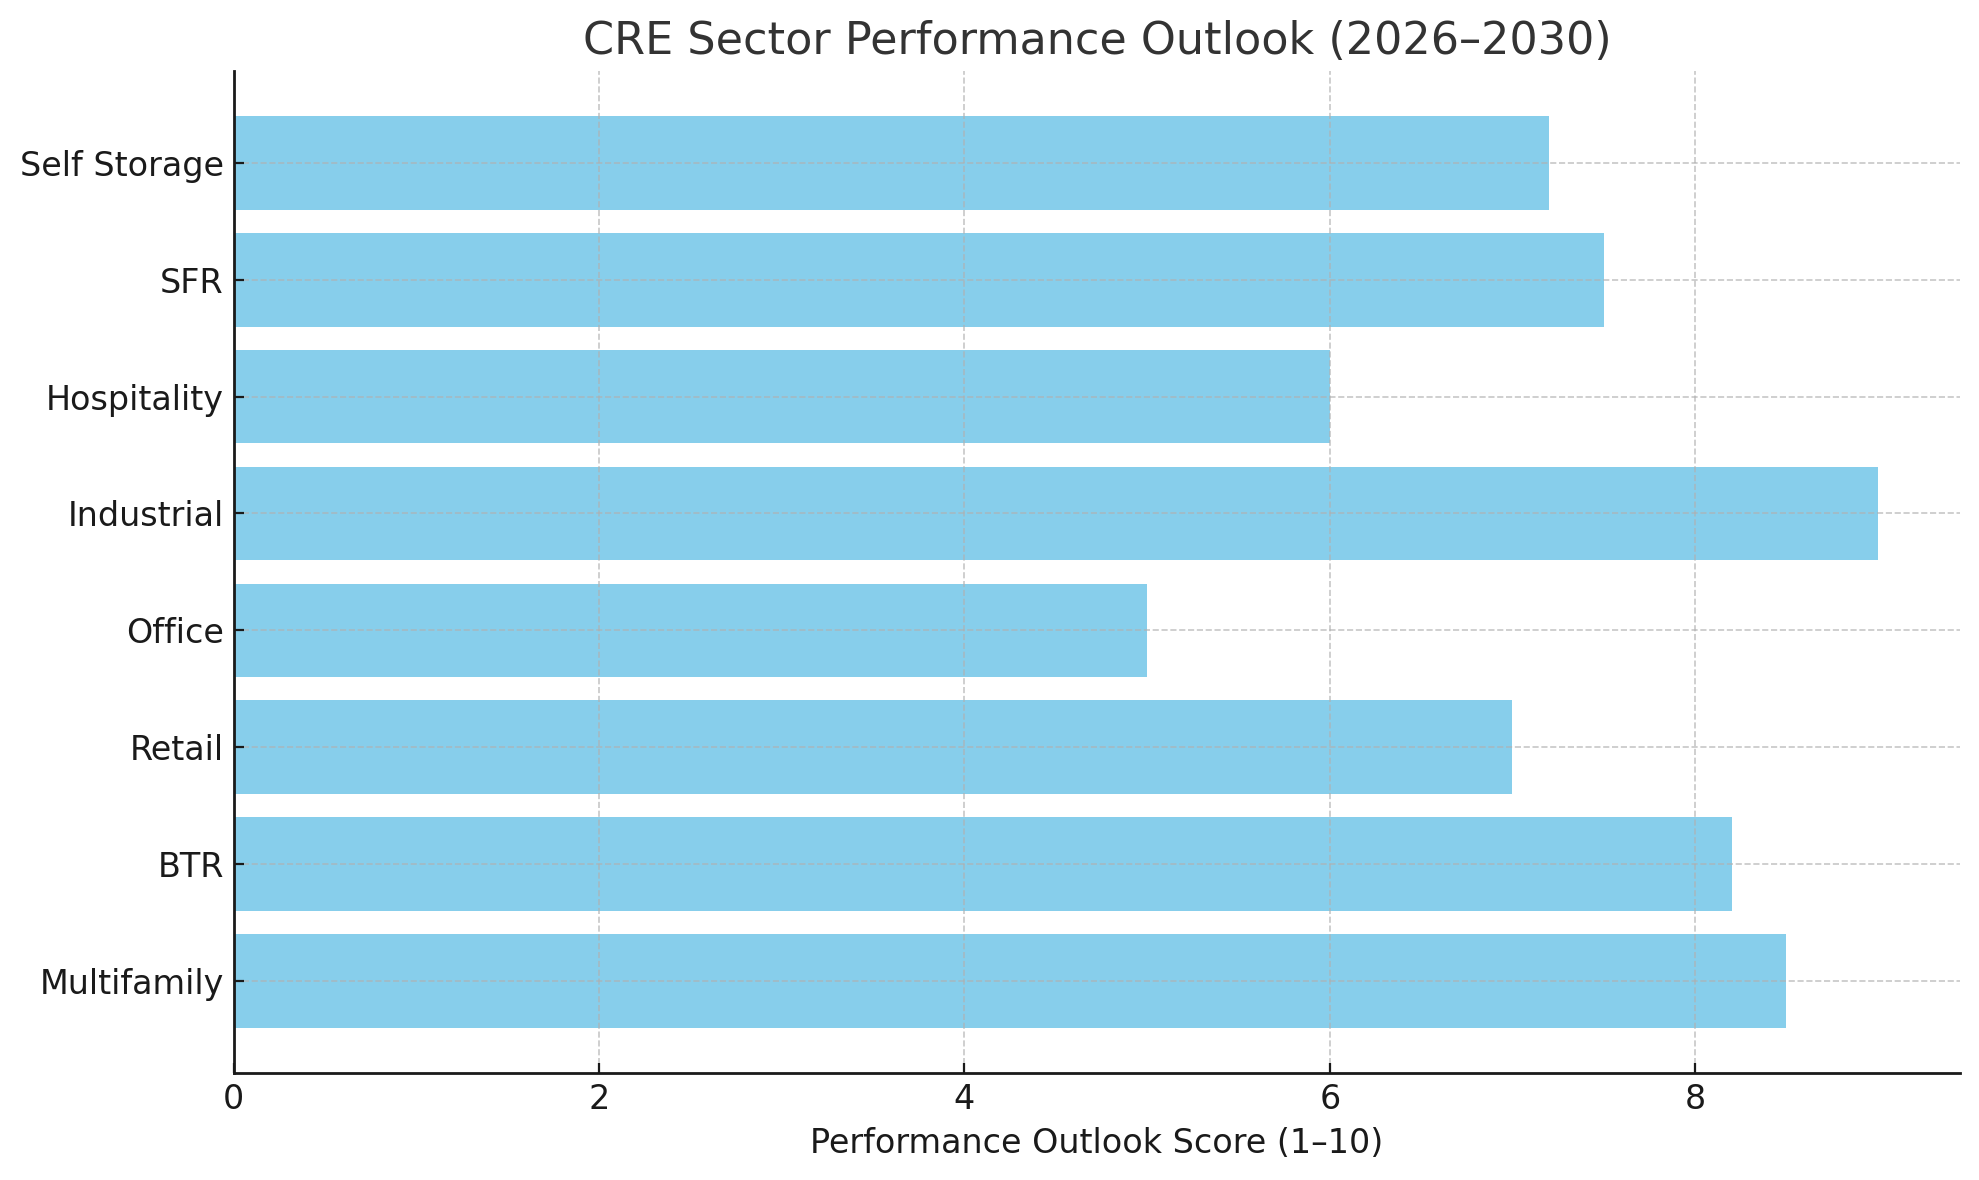
Performance Outlook
Definition:
A composite score representing each sector’s expected overall performance in the 2026–2030 cycle, considering both upside potential and risk-adjusted returns.
Scoring Criteria:
Net Operating Income (NOI) Growth Potential (25%)
Capital Inflows / Investor Sentiment (20%)
Supply/Demand Balance (20%)
Policy/Regulatory Tailwinds or Headwinds (15%)
Liquidity and Exit Market Strength (10%)
Operational Complexity / Cost Control (10%)
Example:
Industrial scores 9.0 because of strong demand fundamentals, nearshoring tailwinds, and manageable supply discipline.
Office scores 5.0 due to bifurcated market dynamics, high vacancy risk, and significant capital expenditure (capex) requirements.
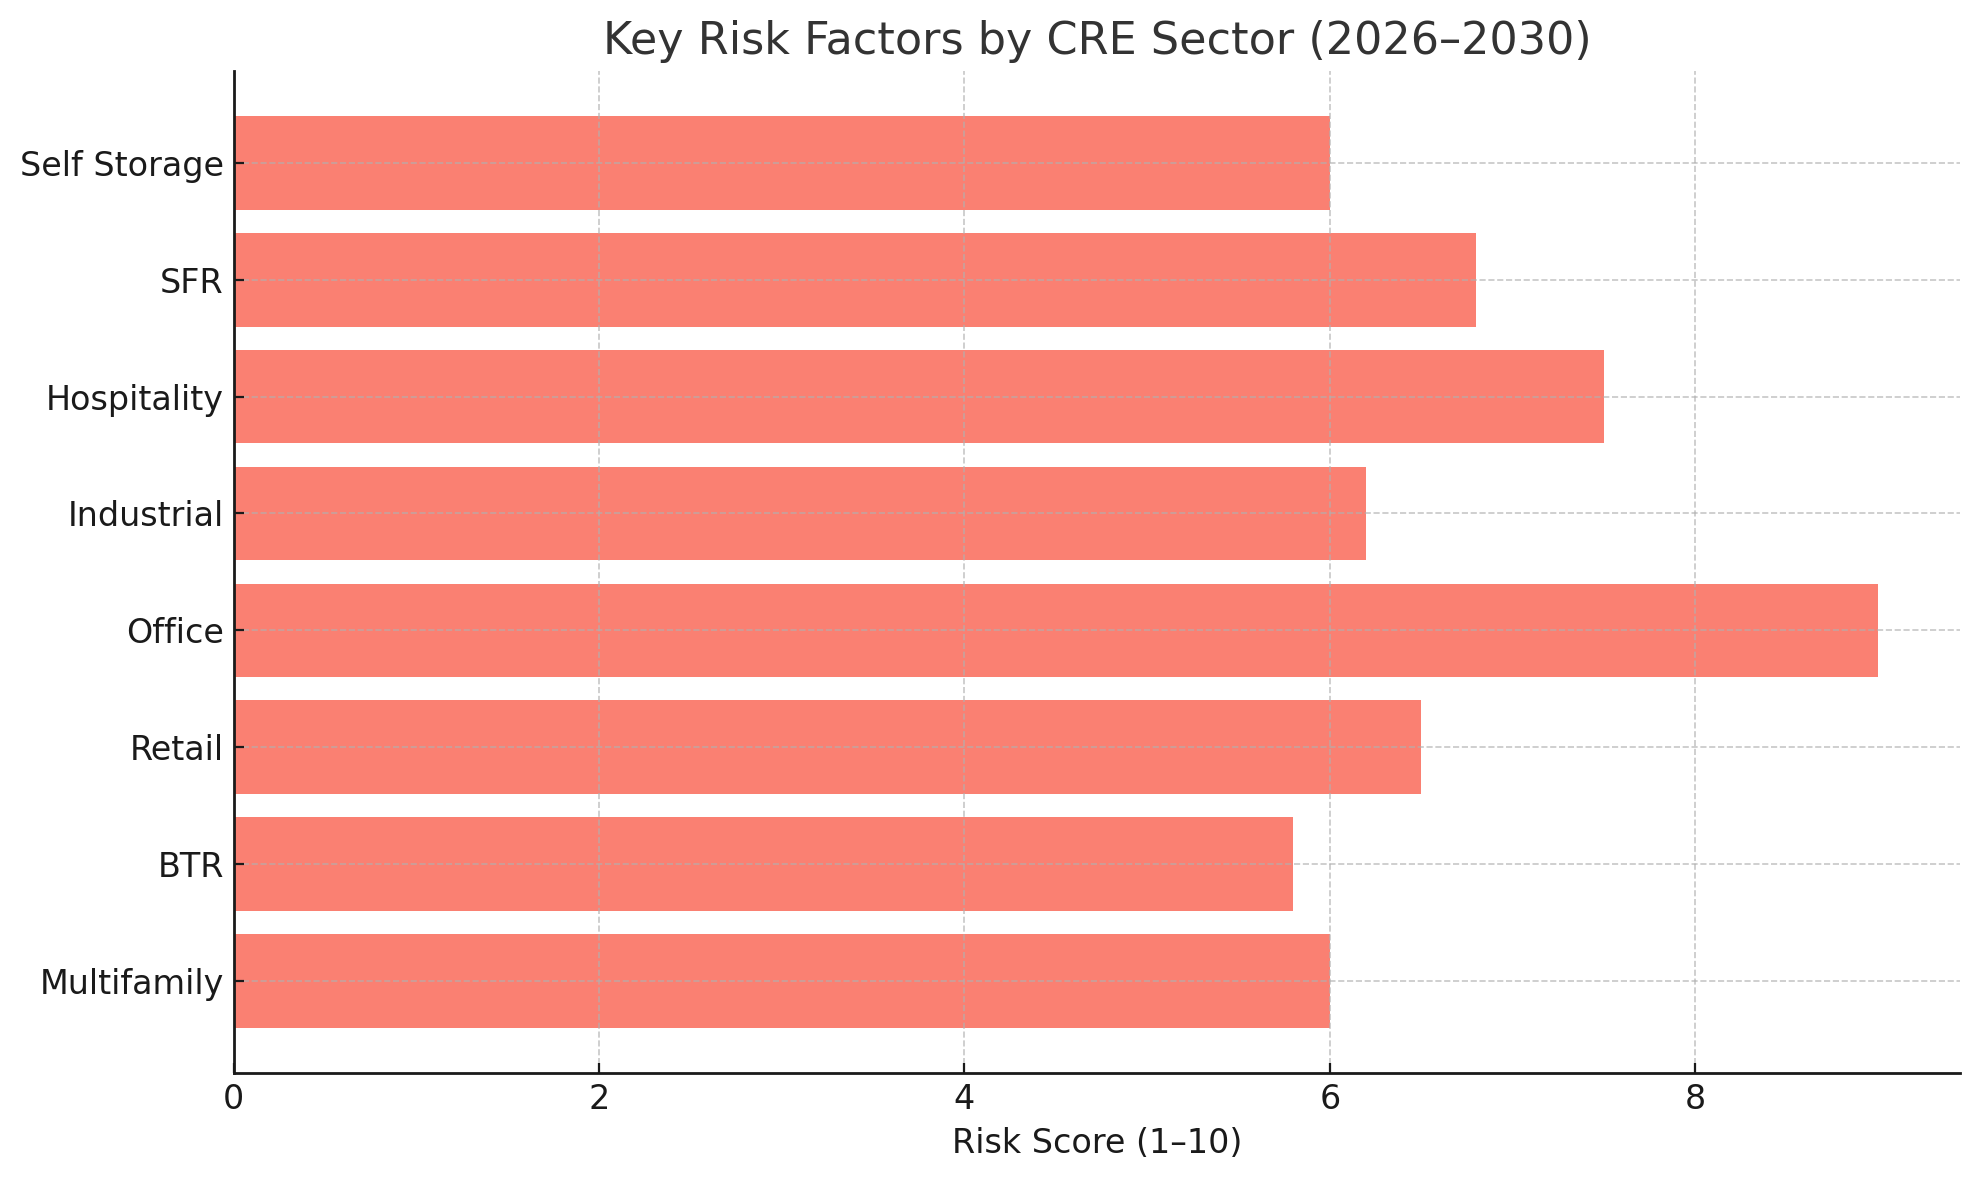
Risk Score
Definition:
A normalized score estimating downside risk or volatility exposure across key variables that could impair performance.
Scoring Criteria:
Refinancing/Maturity Risk (25%)
Regulatory/Policy Uncertainty (20%)
Tenant/User Volatility (20%)
Capex/Insurance Cost Exposure (15%)
Liquidity/Exit Constraints (10%)
Obsolescence/Functional Risk (10%)
Interpretation:
A higher score = higher risk.
Office gets a 9.0 due to elevated refinance wall exposure, weak demand for B/C space, and underfunded capex needs.
BTR gets a 5.8, indicating moderate risk mostly tied to infrastructure costs and municipal resistance.
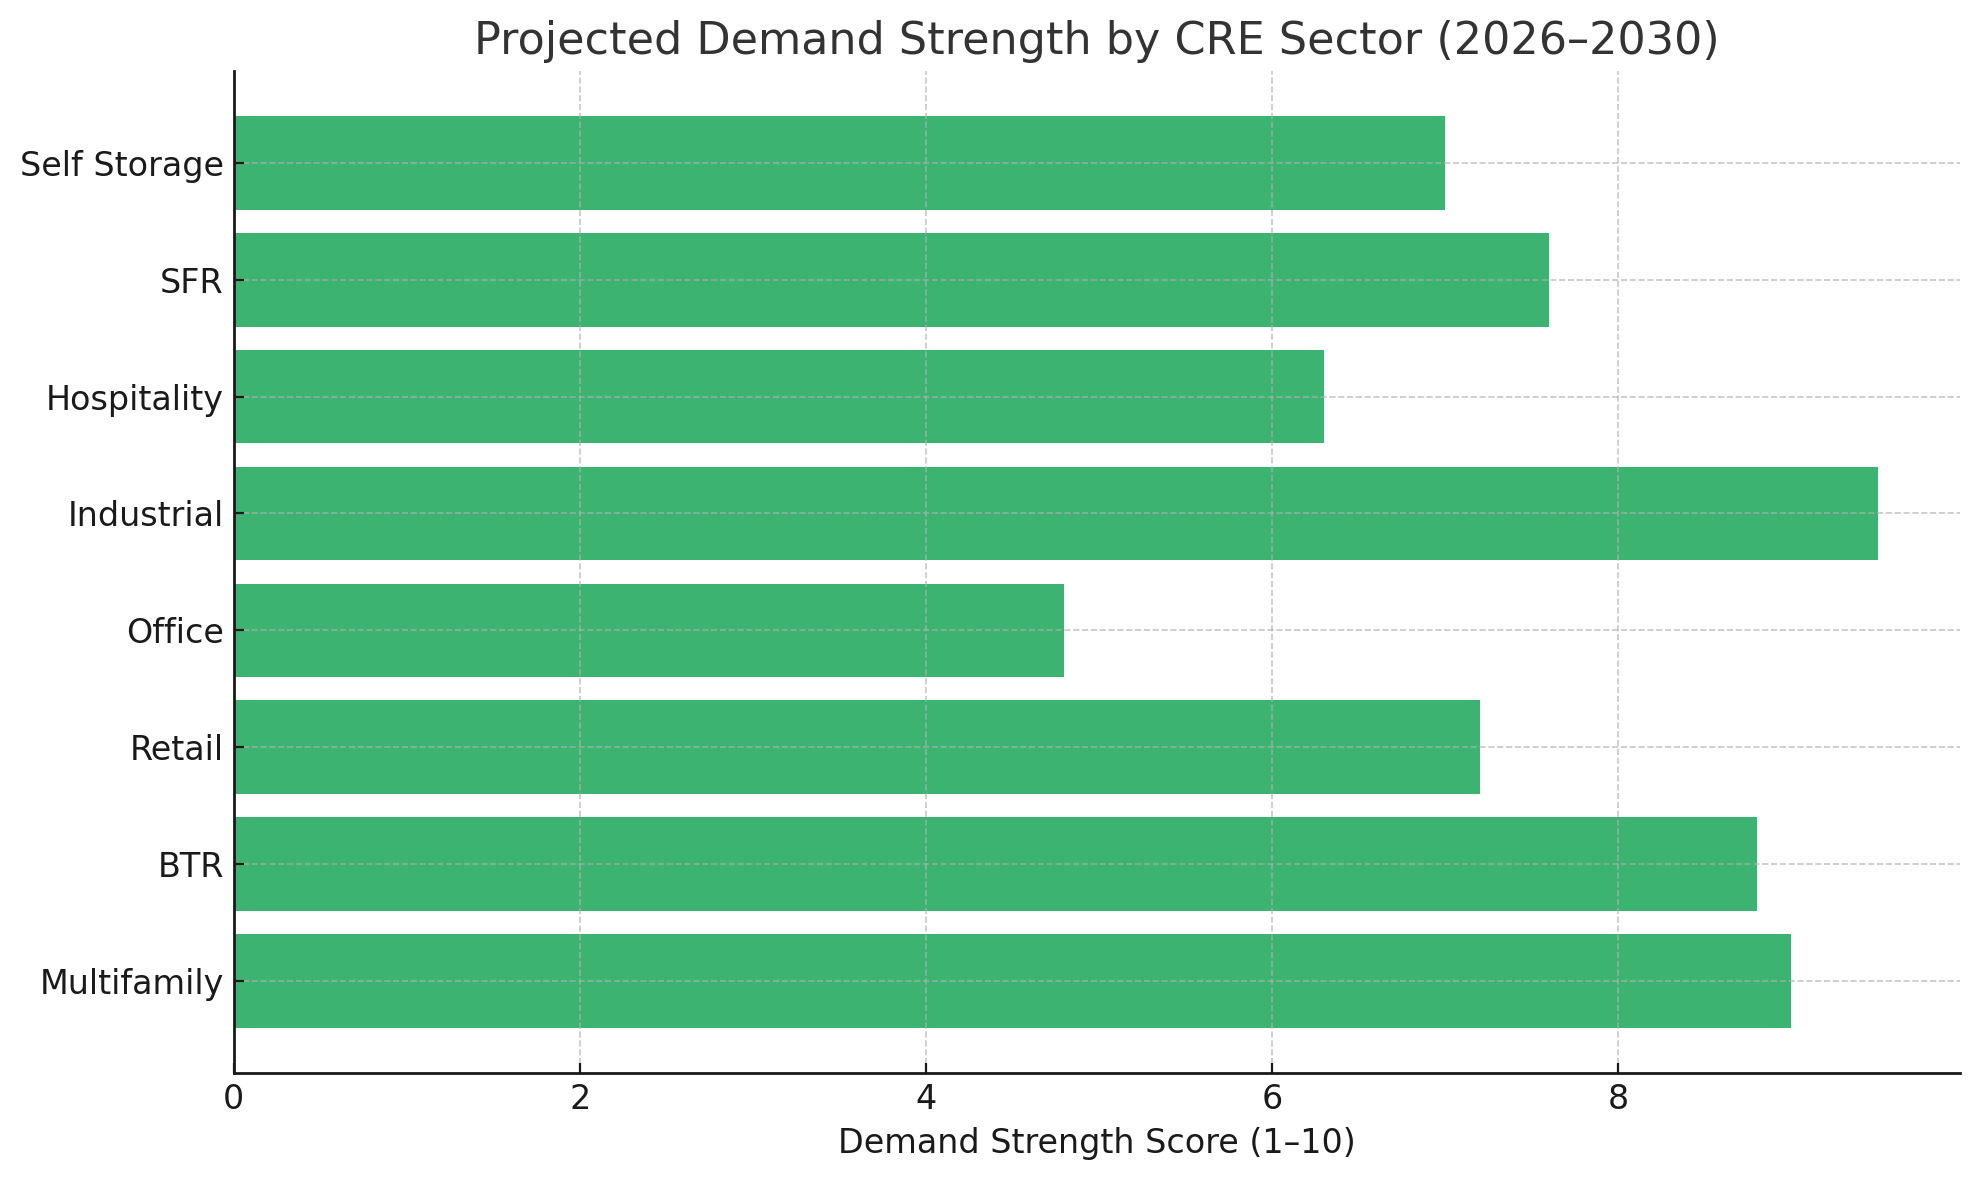
Demand Strength
Definition:
Estimates the strength and persistence of end-user or tenant demand based on secular trends and macro fundamentals.
Scoring Criteria:
Demographic Alignment (Household Formation, Population Growth) (30%)
Affordability/Substitution Elasticity (20%)
Secular Consumption or Operational Trends (20%)
Structural Undersupply or Constraints (15%)
User Stickiness / Retention (15%)
Examples:
Multifamily scores a 9.0 due to strong renter demand supported by affordability constraints and immigration-led household growth.
Industrial leads at 9.5 due to reshoring, logistics complexity, and e-commerce integration.
Office scores just 4.8 due to shrinking aggregate demand, persistent hybrid work, and tenant footprint reduction.
Methodology Behind the Scoring
Each criterion is assessed qualitatively using:
Market research reports (e.g., CBRE, Yardi, NAIOP, JCHS, PWC)
Economic indicators (e.g., interest rate forecasts, inflation trends, migration data)
Policy developments (e.g., rent control, zoning reform)
Transaction and capital markets sentiment
While the scores are not derived from a statistical model, they reflect structured, weighted judgments based on observed data and industry consensus forecasts.
2. The Macro Forces Reshaping CRE Across All Sectors
Before diving into individual sectors, it’s crucial to highlight the macro drivers that will influence all CRE asset classes through 2030. These foundational themes serve as the backdrop for performance, risk, and investment strategy:
Interest Rates & Refinancing Dynamics
Interest rates — and the resulting cost of capital — remain the most important macroeconomic influence on commercial real estate valuations, construction starts, refinancing feasibility, and investment returns. By the end of 2025, the Federal Reserve’s policy range (projected around 3.50%–3.75%) signals that the era of ultra‑low rates is behind us, even as markets price in modest easing relative to peak levels. For CRE investors, this translates to several realities:
Higher‑for‑Longer vs. Rate Normalization: The “higher‑for‑longer” narrative implies sustained borrowing costs above historical averages, compressing cap rates and making refinancing more expensive across many sectors.
CRE Maturity Wall (2026–2027): A wave of loans scheduled to mature will require disciplined refinancing, with lenders maintaining selectivity. This dynamic supports stronger assets but pressures mid‑quality or weak sponsors.
Debt Migration: A growing share of CRE debt will shift toward securitization and private credit markets, rather than traditional bank lending — concentrating risk in newer credit channels.
This structural interest rate environment underscores the importance of underwriting with conservative exit assumptions, robust coverage ratios, and realistic refinancing plans.
Trade Policy, Tariffs & Industrial Policy Spending
Macro trade policy — including tariffs, negotiations, and geopolitics — disrupts cost structures and goods movement flows. These effects resonate most strongly in:
Industrial real estate, where reshoring and nearshoring lead companies to bring production and distribution closer to domestic markets. This increases demand for modern logistics, cold storage, and specialized manufacturing space.
Retail, where tariff‑induced cost inflation on consumer goods can both limit discretionary spending and influence tenant profitability.
Savvy investors must track trade policy shifts closely, as they can reshape logistics demand patterns and redefine market competitiveness on both coasts and inland corridors.
Supply Chains, Logistics & Reshoring Demand
The global pandemic accelerated supply chain reconfiguration. Now, in 2025 and beyond, many companies are seeking redundancy, resilience, and proximity through nearshoring and shorter supply lines. The most likely outcome is secular growth in:
Border markets (especially along the U.S.–Mexico border).
Inland ports and logistics hubs.
Cold storage logistics and high‑power industrial facilities.
This trend supports long‑term industrial demand — not just for large warehouse facilities, but for specialized, power‑intensive space essential for modern supply chains.
Demographics, Household Formation & Migration Patterns
Demographics matter. Population growth, household formation rates, aging trends, and migration flows will influence rental housing demand, retail spending, and labor markets. Key points include:
Household formation trends tied to immigration and Millennial/Gen Z life stages will support demand for multifamily housing and BTR options.
Aging population dynamics will drive particular demand for amenity‑light multifamily products, accessible housing, and service‑oriented real estate concepts.
Investment strategy should integrate deep demographic analysis — not just national metrics, but submarket‑level population and migration insights.
Local Policy & Regulation
City and state policy decisions around permitting, rent regulation, zoning, and conversion incentives will create geographic performance dispersion across the CRE universe.
In housing markets, rent regulation and permitting restrictions can reshape multifamily investment fundamentals.
In the office sector, zoning and incentives determine conversion feasibility and long‑term viability.
Investors must evaluate local policy risk with the same rigor as traditional underwriting factors.
3. Multifamily Real Estate Outlook
Multifamily real estate has been a stalwart of CRE portfolios, and its performance through 2026–2030 will hinge on a mix of supply absorption, financing dynamics, and demographic demand.
Multifamily Outlook: 2026–2030
2026–2027: Recovery Phase
After a significant supply wave in the early 2020s, the mid‑decade is likely to be a recovery period, where:
Deliveries slow as construction activity adjusts to higher financing costs.
Occupancies rebound as new units are absorbed.
Rent growth becomes more consistent in markets with strong job growth and limited supply.
However, performance will vary widely across metros and submarkets, with newer product outperforming older stock.
2028–2030: Normalization with Policy Friction
Heading into the late 2020s, multifamily markets may normalize, but with notable policy headwinds:
Expanded rent regulation in high‑cost metros could constrain NOI upside.
Older buildings may defer capex due to regulatory and operating pressures.
Capital may rotate toward exempt or newer product types.
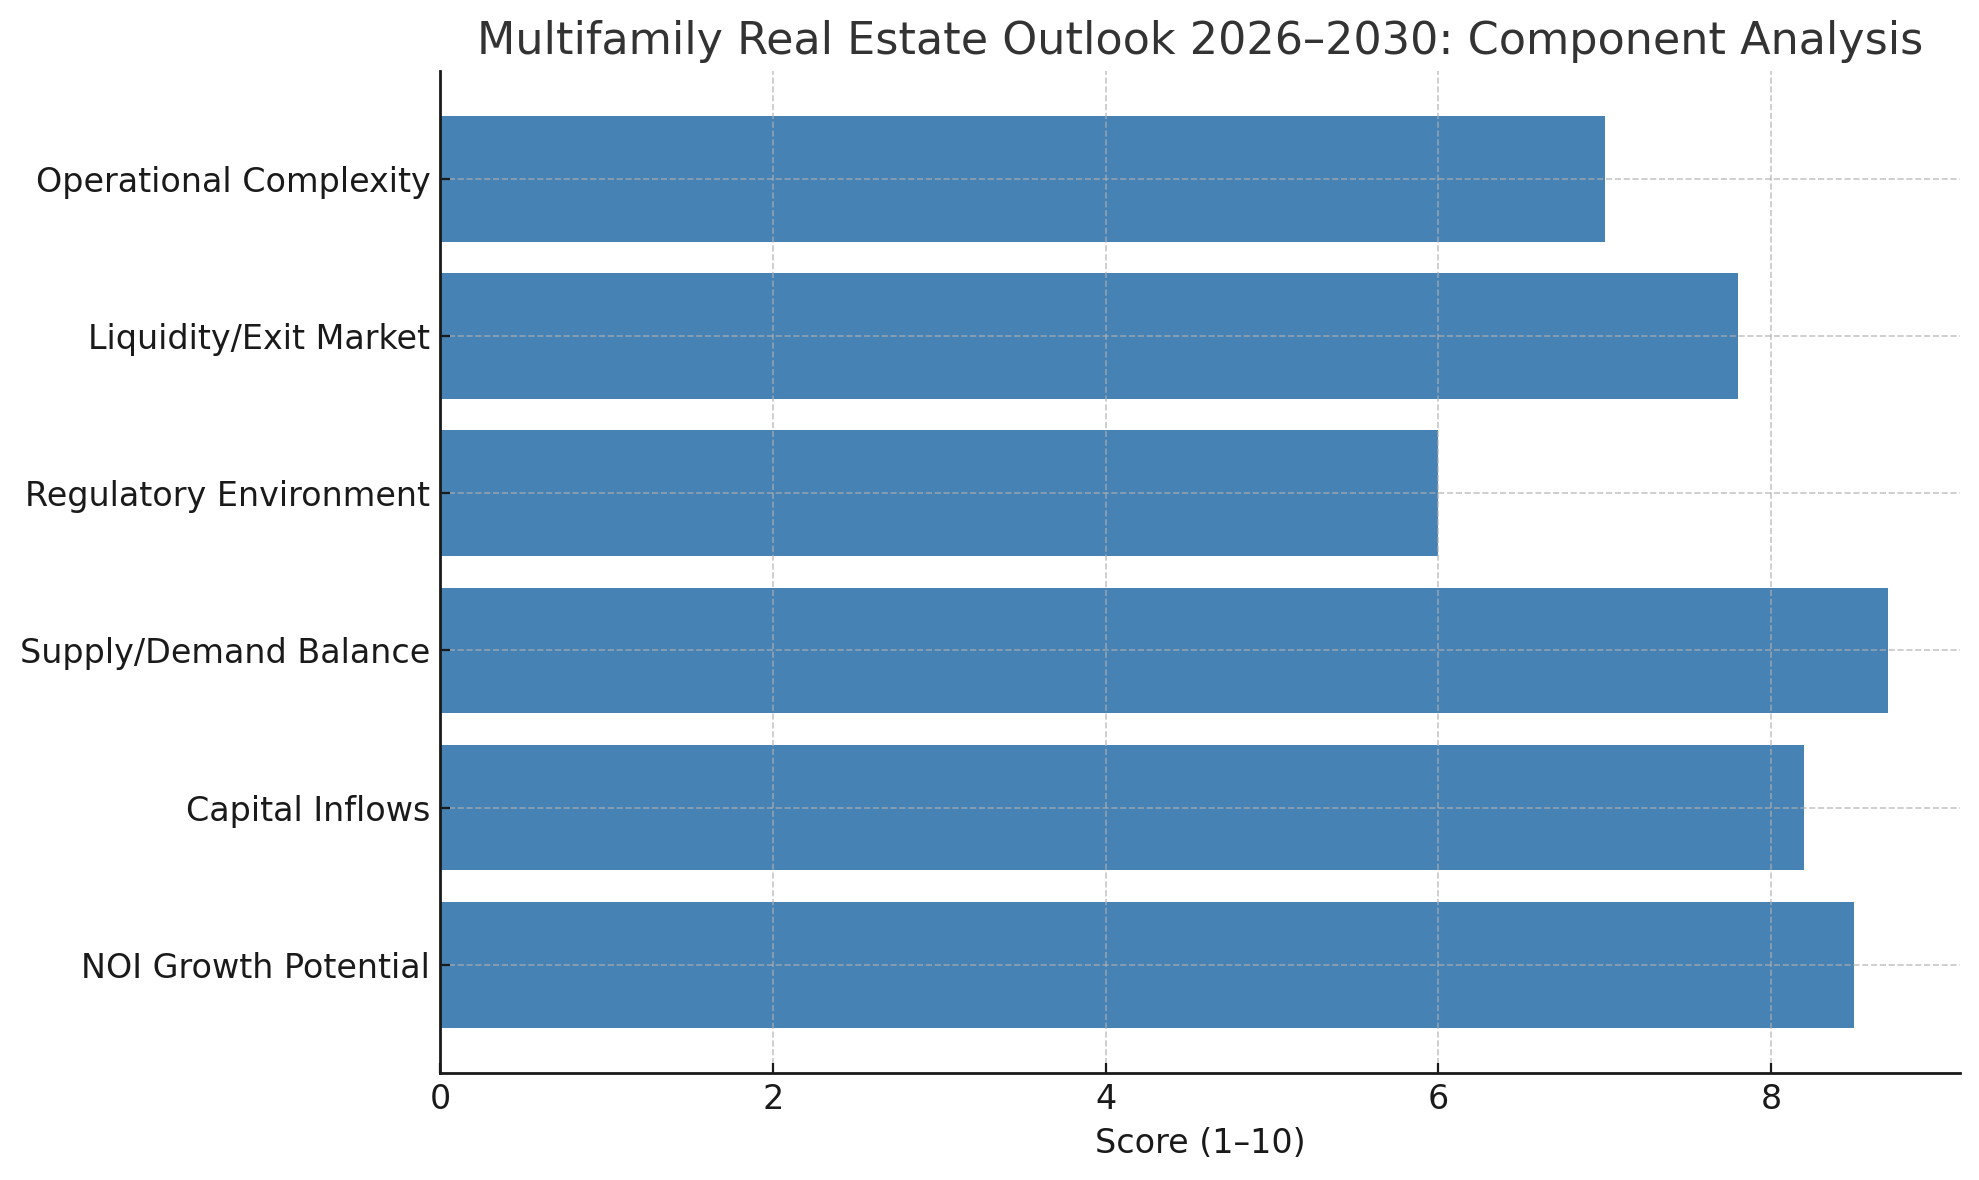
Here's a detailed chart analyzing the Multifamily Real Estate Outlook (2026–2030) across six performance components:
NOI Growth Potential and Supply/Demand Balance score highest, reflecting strong rental demand and slowing new supply.
Capital Inflows and Liquidity also remain favorable due to institutional appetite and agency financing support.
Regulatory Environment scores lower due to rising rent control risks in key markets.
Macro & Micro Drivers to Watch in Multifamily
Understanding the drivers that will shape multifamily performance is critical:
Rates & Refinancing
Agency execution continues to stabilize the sector, but private credit will fill lending gaps where traditional lenders remain cautious. Watch for Debt Service Coverage Ratio (DSCR) stress within deals originated between 2021–2023.
Regulation
Rent control, permitting friction, and zoning changes will greatly affect development pipelines. Markets with draconian rent regulation may see capital migrate toward friendlier jurisdictions.
Demographics
Household formation will underpin rental demand. Immigration policy shifts — either expansion or contraction — could materially influence absorption trends.
Multifamily Winners & Risks
Most Likely Winners:
Newer, energy‑efficient, amenity‑rich apartments near transit and employment hubs.
Workforce housing in areas where replacement cost is high and new supply is constrained.
Key Risks:
Exit cap stagnation vs. debt costs: If cap rates remain wide relative to borrowing costs, transaction velocity may stall.
Regulatory headwinds in high‑growth markets can dampen returns and slow development.
4. Build‑to‑Rent (BTR): A Structural Growth Story
The build‑to‑rent sector has emerged as a distinct asset class, blending strengths from multifamily and single‑family housing (SFR) markets.
BTR 2026–2030: Structural Growth with Granularity
The build‑to‑rent sector will continue to take share of new rental supply, particularly in suburban and exurban corridors. BTR resonates with households seeking space, yards, community amenities, and professional management — all without homeownership commitments.
Greater Segmentation
Over the next five years, expect BTR to diversify into product types:
Detached single‑family units.
Townhomes.
Cottage‑style community designs.
Each configuration will attract different household segments and price points.
Institutional Scale vs. Fragmented Ownership
Institutional capital will increasingly favor operators with data‑driven leasing, standardized construction practices, and scalable maintenance platforms. Meanwhile, scattered SFR ownership will remain fragmented but challenged by efficiency and cost‑to‑serve economics.
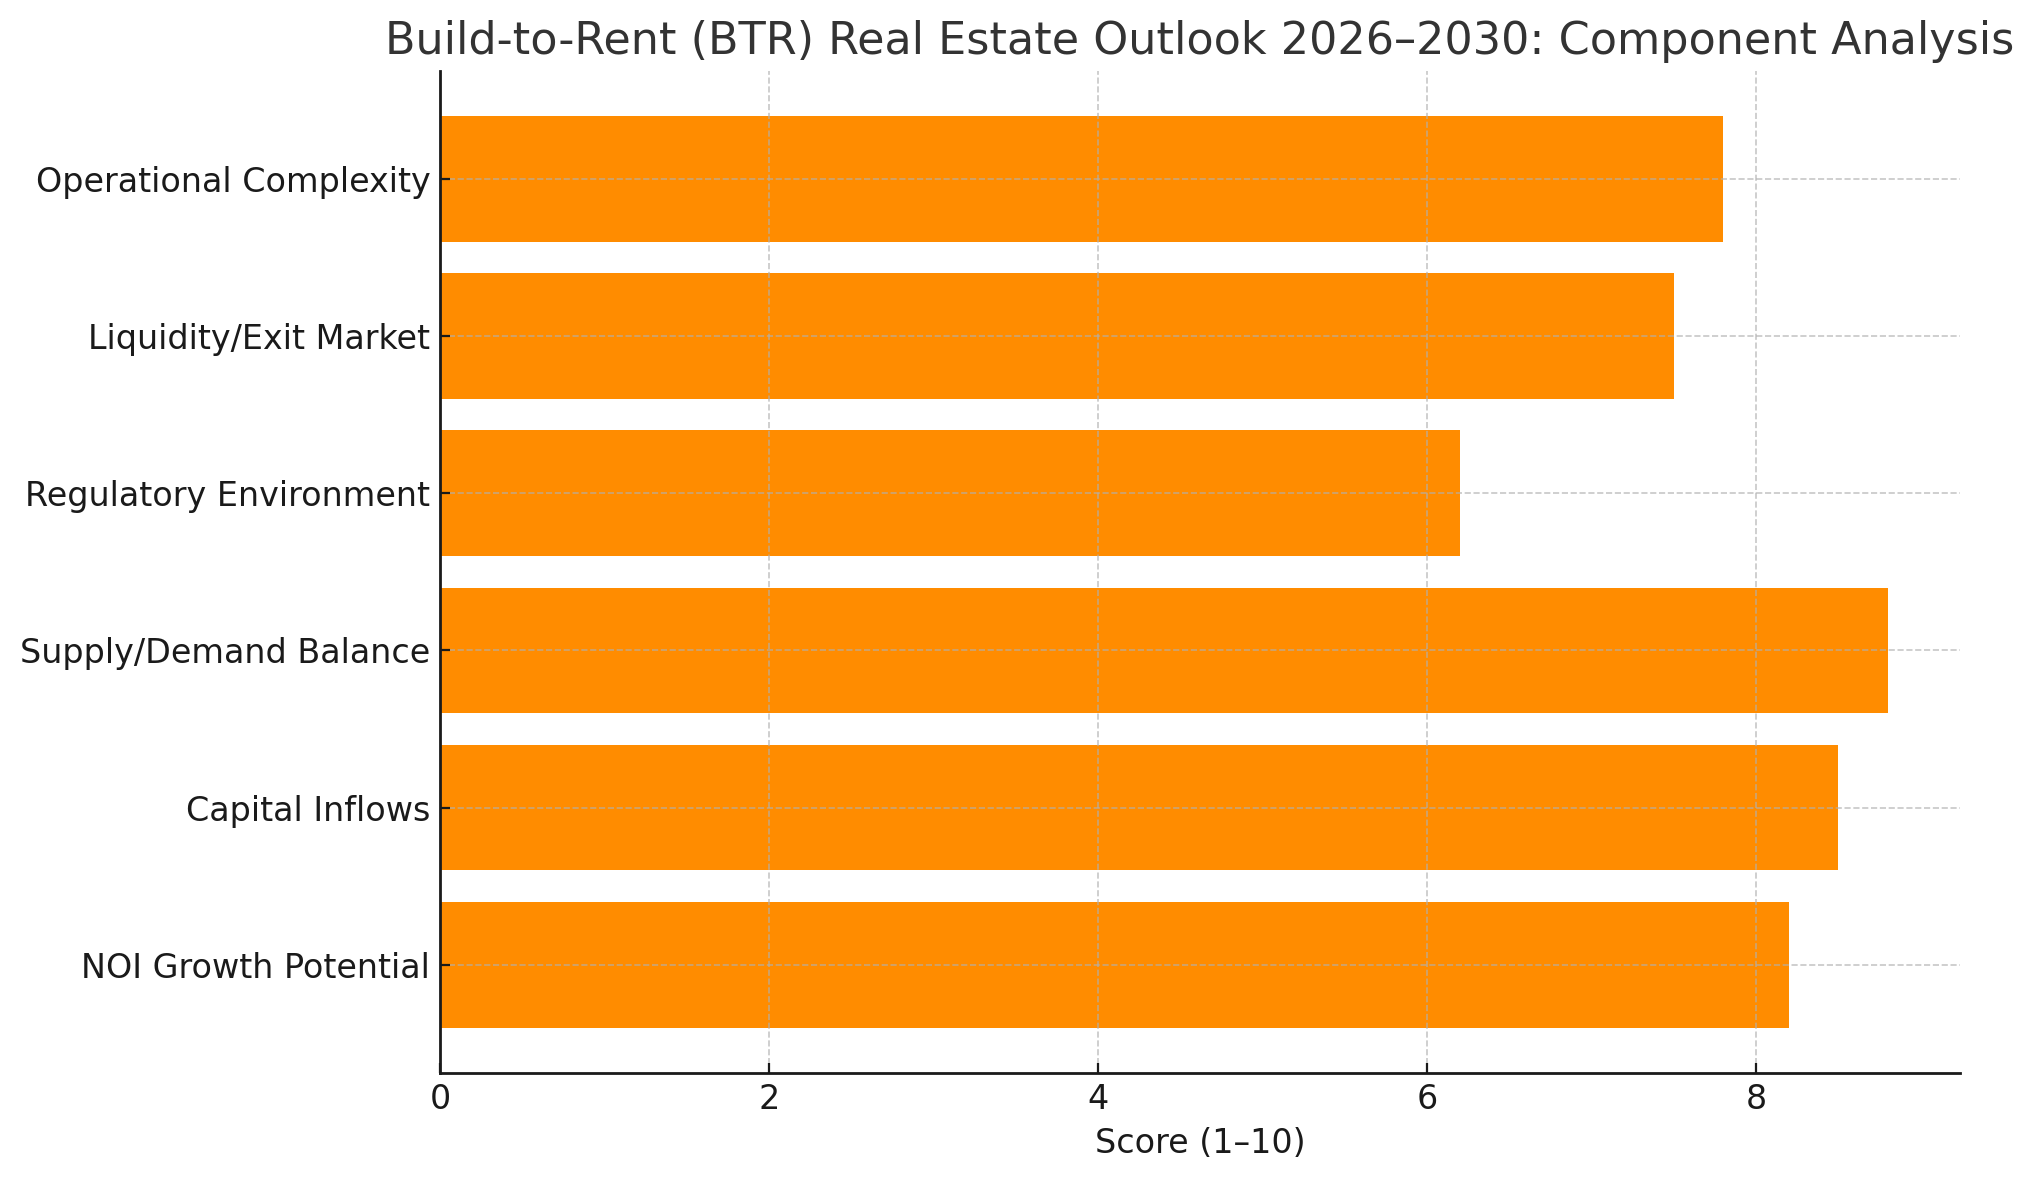
Here is the Build-to-Rent (BTR) Real Estate Outlook for 2026–2030, broken down by key performance components:
Supply/Demand Balance and Capital Inflows are particularly strong, driven by rising family rental demand and institutional platform growth.
Operational Complexity scores well due to scalable models and standardized maintenance.
Regulatory Environment remains a concern in some municipalities, though generally more favorable than multifamily.
BTR Drivers & Strategic Themes
Rates & Mortgage Lock‑In
If mortgage rates remain elevated, buyers may stay priced out of homeownership, bolstering demand for professionally managed BTR communities.
Construction Costs & Tariffs
Horizontal development is materials intensive. Volatility in construction inputs — from lumber to steel — will drive underwriting sensitivity.
Demographics & Lifestyle Trends
Family formation, hybrid/remote work, and school district preferences will continue to pull renters to well‑located BTR communities.
BTR Winners & Risks
Most Likely Winners:
BTR developments in submarkets with strong schools, employment nodes, and constrained for‑sale supply.
Operators with scalable maintenance and resident experience platforms.
Key Risks:
Municipal pushback (e.g., growth caps or impact fees).
Infrastructure and insurance costs, particularly in regions prone to weather risk.
5. Retail Real Estate: Polarization & Resilience
The retail sector remains polarized, with necessity‑based formats outperforming undifferentiated retail space.
2026–2030 Retail Outlook
Persistence of Polarization
Retail sector performance will continue to divide along these lines:
Winners: Grocery‑anchored centers, value‑oriented retail, service‑heavy tenants (medical, fitness, QSR).
Losers: Commodity retail with weak differentiation or heavy exposure to discretionary categories.
Limited New Supply
Ground‑up retail development remains modest due to financing and entitlement hurdles — a dynamic that protects pricing power for well‑located, well‑tenant‑mixed centers.
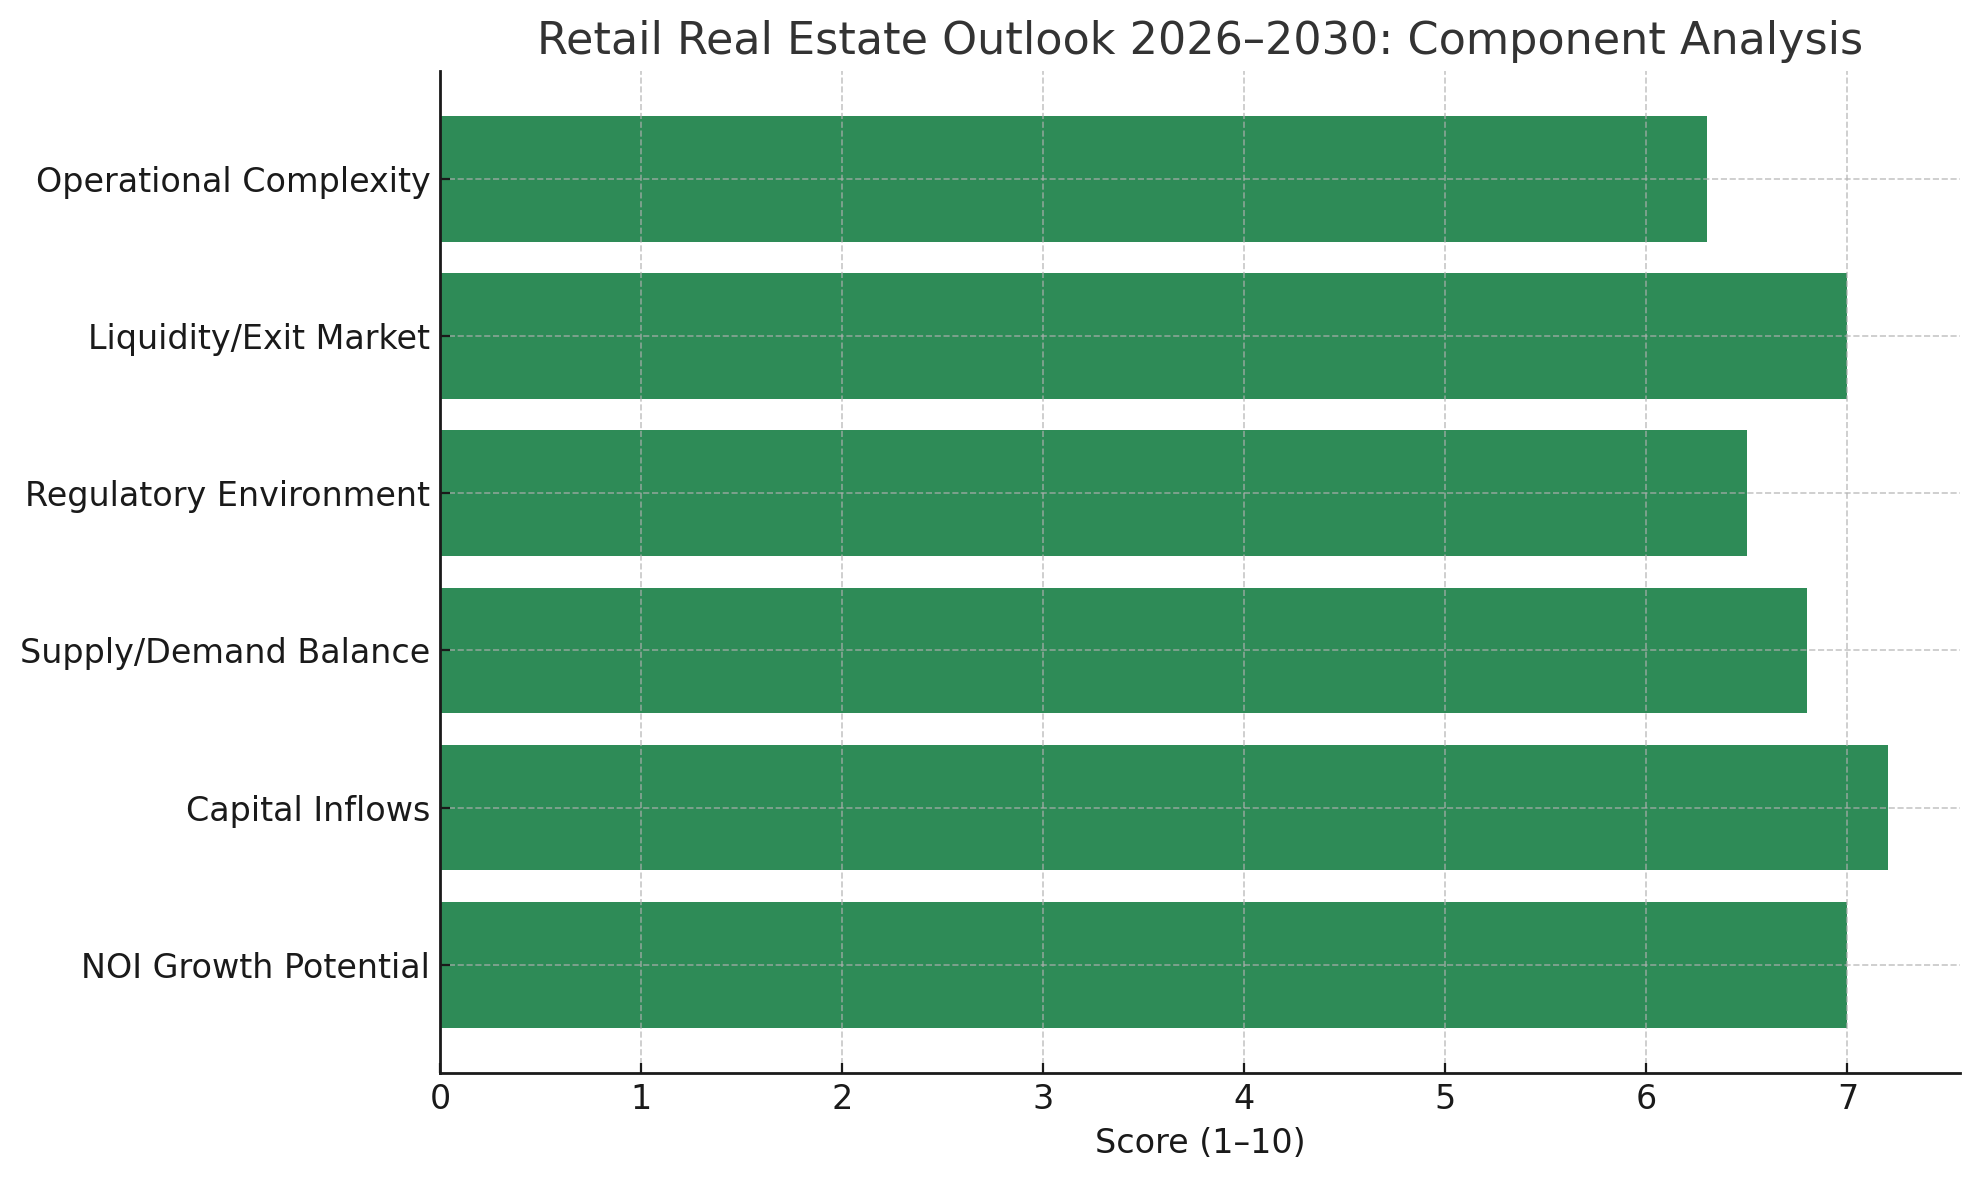
Here’s the Retail Real Estate Outlook (2026–2030) visualized by component:
Capital Inflows and NOI Growth Potential are moderate, reflecting stable interest in grocery-anchored and service retail.
Regulatory Environment and Operational Complexity are sector-specific and vary widely depending on format and location.
Supply/Demand Balance benefits from limited new development, supporting rents in well-located assets.
Retail Sector Drivers
Consumer Health & Spending
Rate reductions help big‑ticket consumer spending, while tariff‑driven input costs can shrink retailer margins and limit discretionary sales growth.
Omnichannel Integration & Last‑Mile Logistics
High‑performing retail assets increasingly serve dual roles: traditional shopping destinations and last‑mile logistics/returns hubs — adding strategic value.
Retail Winners & Risks
Most Likely Winners:
Grocery‑anchored centers with strong income demographics.
Centers with daily‑needs demand and service tenancy mix.
Key Risks:
Tariff‑induced increases in COGS.
Tenant closures in apparel and home‑goods categories.
Rising insurance and common area maintenance (CAM) costs.
6. Office Sector: A Tale of Two Markets
The office market is arguably the most disrupted CRE sector, reflecting shifting workplace norms and structural changes in demand.
Office 2026–2030 Outlook
Two‑Market Reality
Office performance will diverge sharply:
Prime, Class A, amenity‑rich, transit‑oriented buildings will continue to attract tenants.
Commodity Class B/C assets will see persistent vacancy and leasing challenges.
Conversions & Removals
Conversions — to residential, hotel, or lab space — will become increasingly meaningful, though not sufficient to absorb all excess space.
Distress Dynamics
A refinance wall and valuation reset will generate waves of recapitalizations, note sales, and selective foreclosures — especially for older assets requiring significant capex.
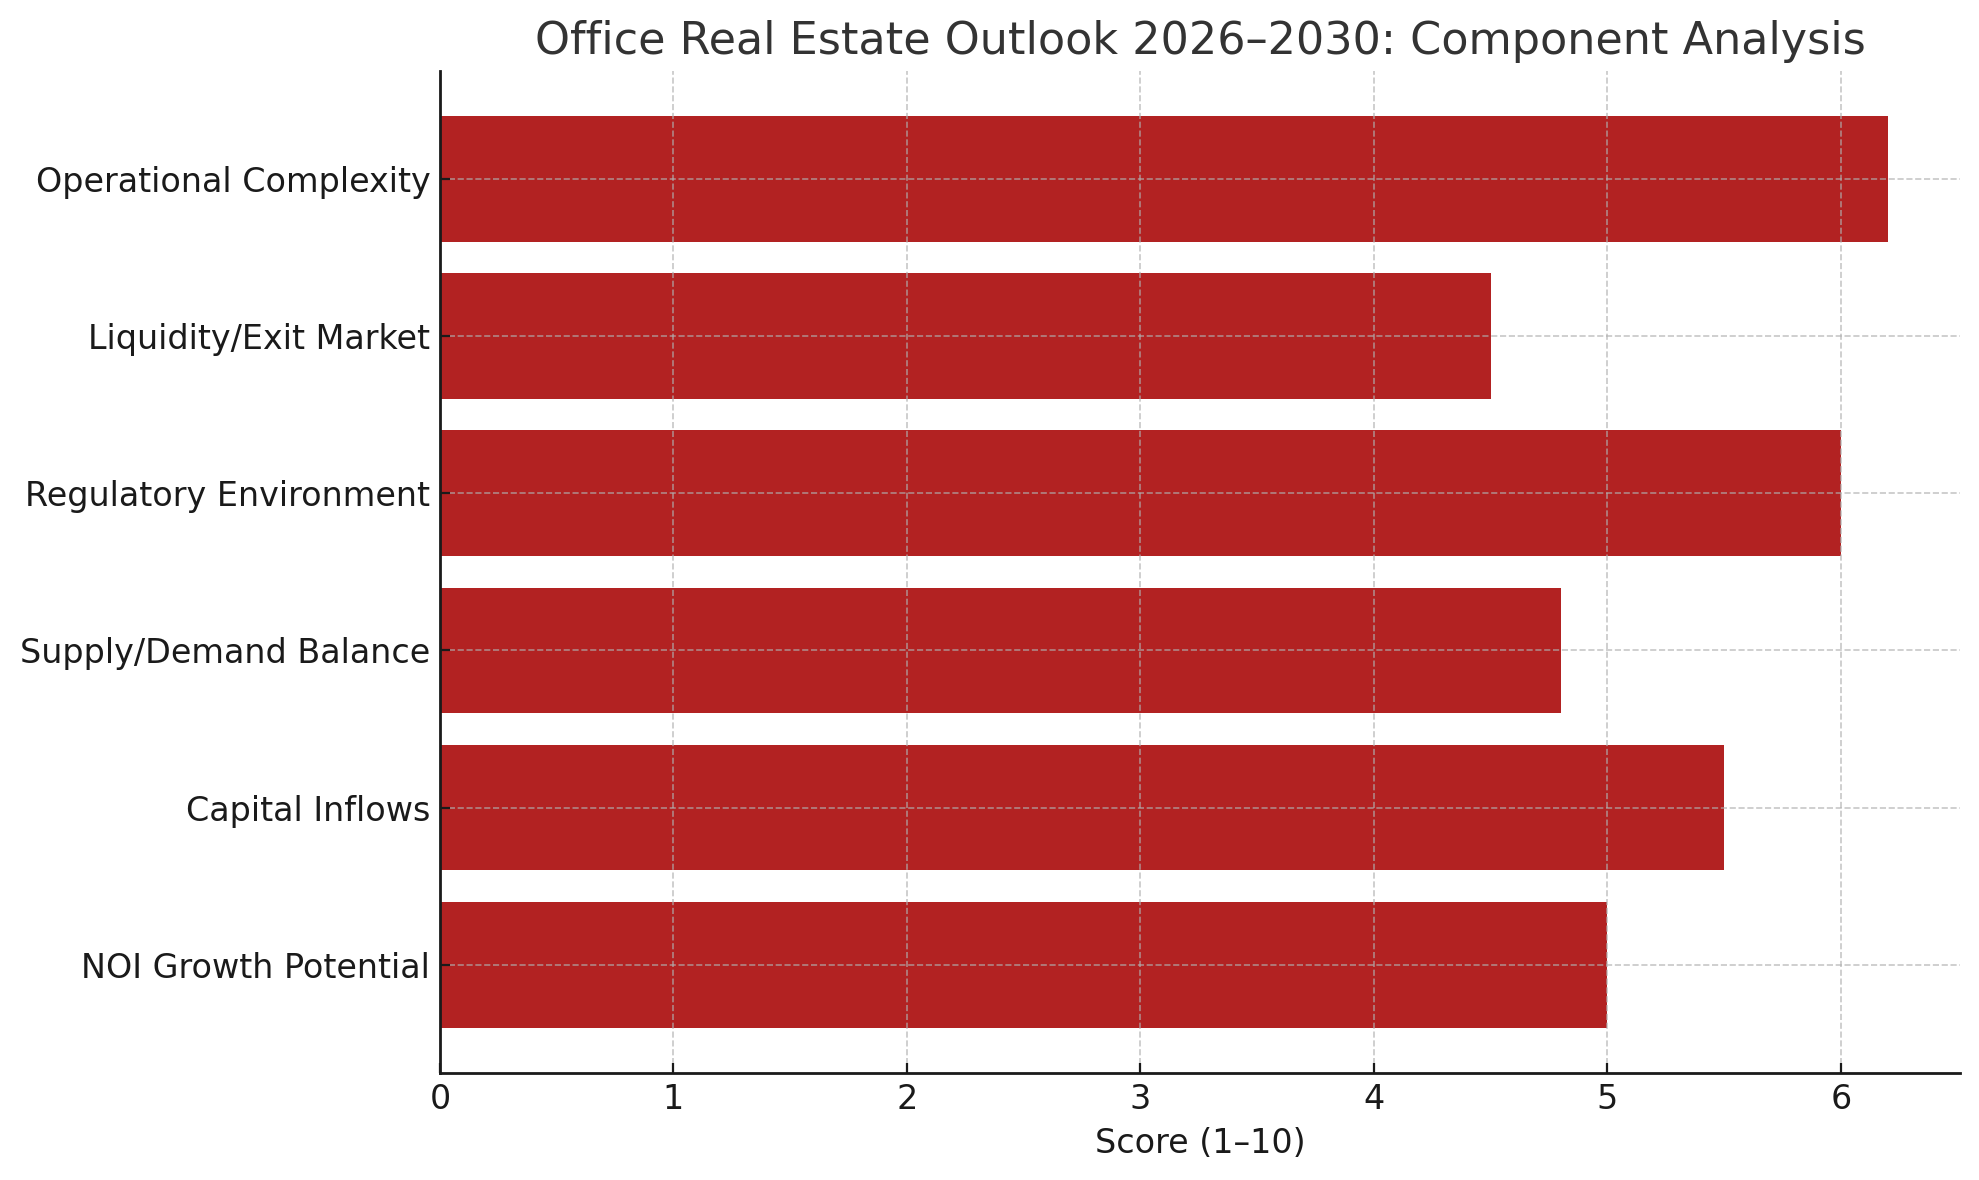
Here's the Office Real Estate Outlook (2026–2030) breakdown:
NOI Growth Potential, Liquidity, and Supply/Demand Balance score lowest due to persistently high vacancy, limited leasing velocity, and structural obsolescence.
Regulatory Environment and Operational Complexity vary significantly based on conversion potential and asset class (A vs. B/C).
Capital Inflows remain subdued, though selective opportunities exist in conversions and trophy assets.
Office Sector Drivers
Interest Rates
Every 100 basis point movement affects conversion economics and refinancing outcomes.
Employment Mix
Growth in high‑wage sectors (tech, finance, professional services) and government spending cycles will influence office demand by market.
Return‑to‑Office Norms
While full reversion to pre‑pandemic norms is unlikely, stabilization is feasible — particularly for high‑quality space.
Office Winners & Risks
Most Likely Winners:
Best‑in‑class, supply‑constrained core assets with completed ESG/MEP upgrades.
Conversion candidates with favorable floorplates and supportive policy environments.
Key Risks:
B/C office demand erosion.
Capex underfunding leading to “zombie buildings” that drag down district performance.
7. Industrial Property: Modern Logistics & Trade Flows
Industrial real estate remains one of the most compelling CRE sectors long‑term, driven by supply chain reconfiguration, e‑commerce, and advanced logistics demand.
Industrial 2026–2030 Outlook
Steady Demand Amid Mid‑Cycle Pause
After a pandemic‑era boom, industrial demand is stabilizing. However, nearshoring/reshoring dynamics and e‑commerce fulfillment needs set the stage for renewed growth.
Specialization & Power Intensity
Facility requirements will favor:
Cold storage space.
High‑clear height distribution centers.
Power‑intensive logistics nodes integrated with automation.
Trade Policy Impact
Tariffs and trade policy volatility influence trade flows and logistics footprints — buoying demand in border, inland port, and intermodal markets.
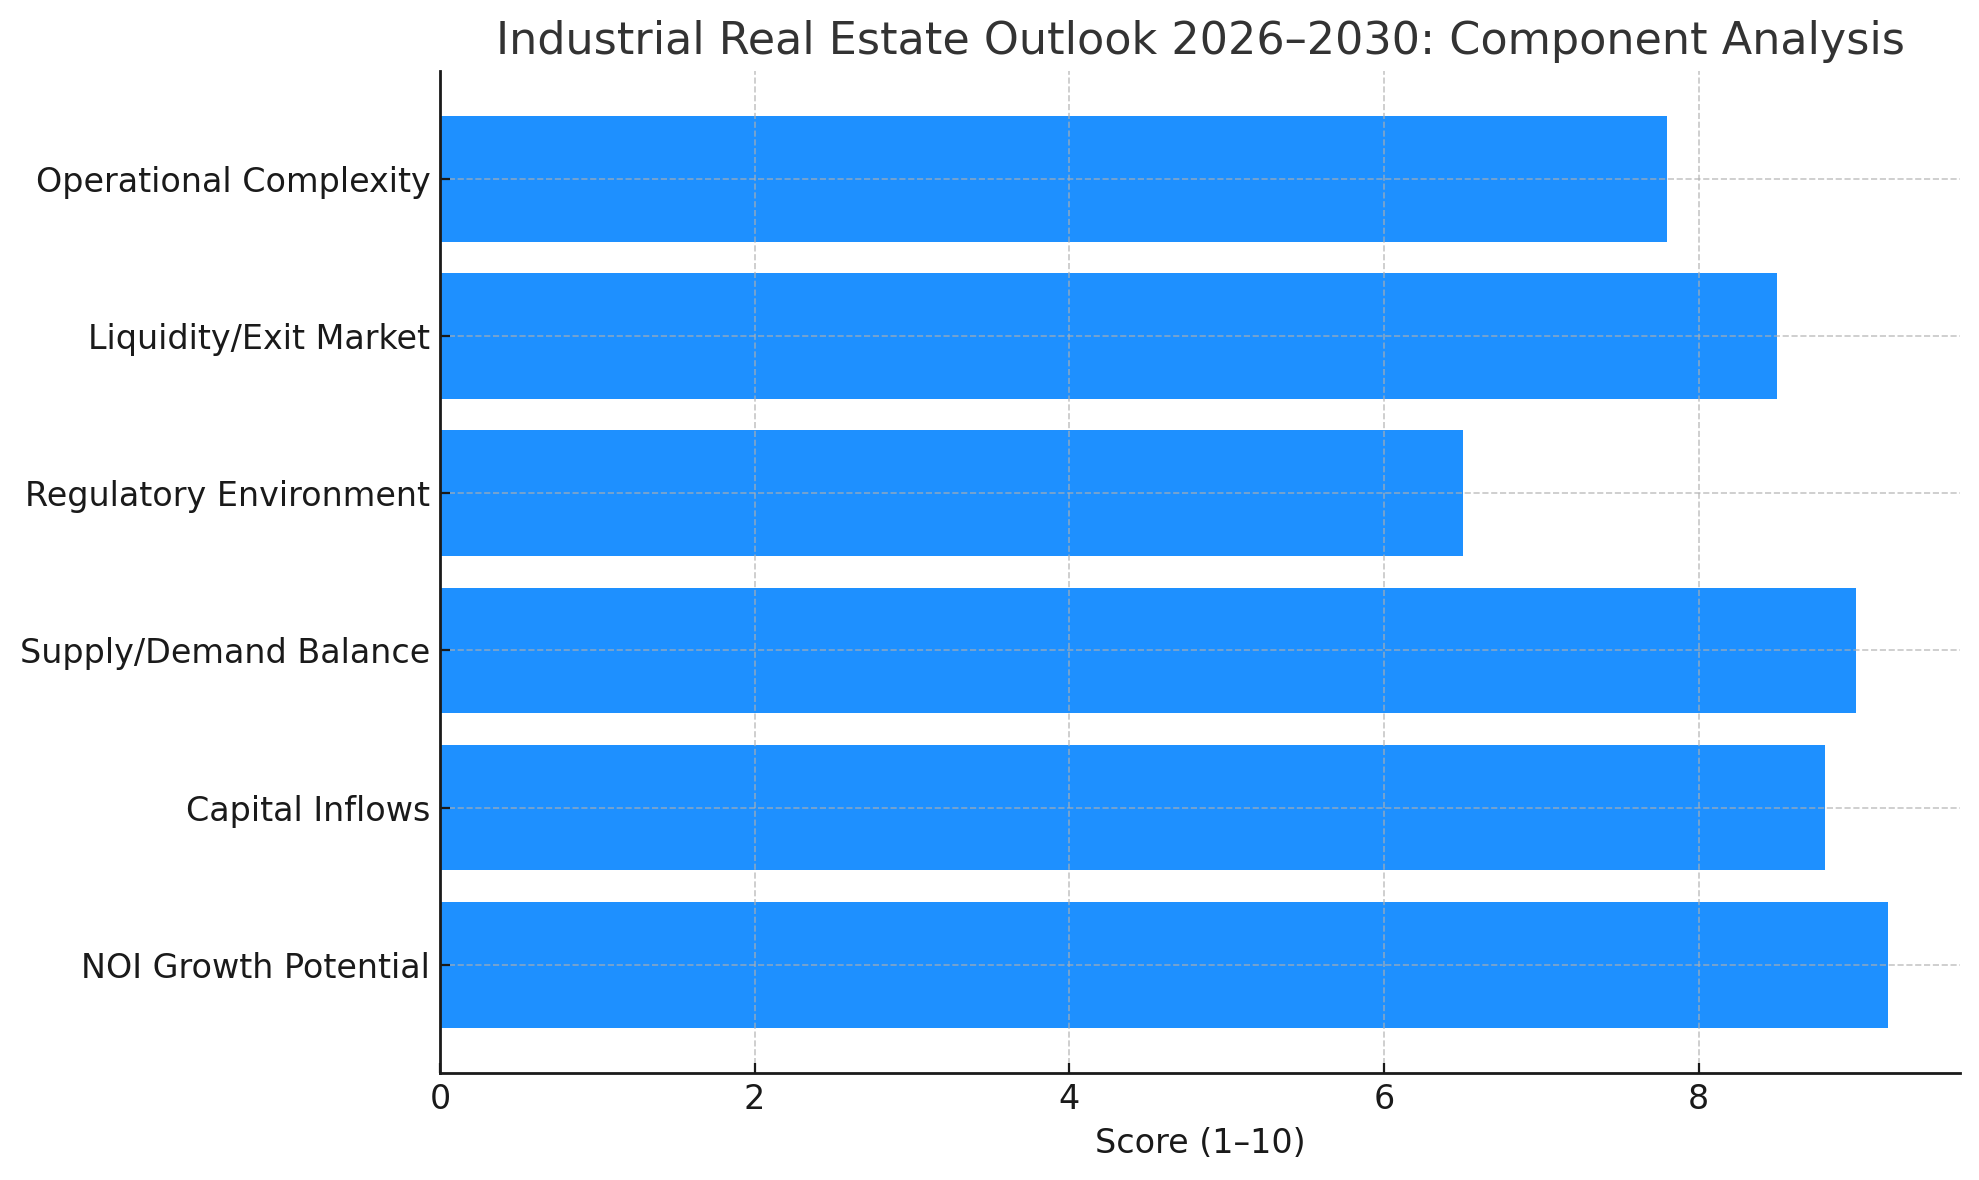
Here’s the Industrial Real Estate Outlook (2026–2030) by component:
NOI Growth, Supply/Demand Balance, and Capital Inflows score extremely high due to nearshoring, automation, and logistics expansion.
Liquidity remains strong in modern logistics markets.
Regulatory Environment is less impactful but still relevant for zoning and power access.
Industrial Sector Drivers
Tariffs & Supply Chain Resiliency
Short‑term tariff impacts can slow volumes, but medium‑term responses include reshoring facilities that boost industrial absorption.
Labor & Automation
Sites that support automation and workforce attraction will outperform.
Industrial Winners & Risks
Most Likely Winners:
Modern logistics facilities in infill and border/intermodal nodes.
Light industrial space that serves small‑bay and repair demand.
Key Risks:
Oversupply pockets from speculative deliveries.
Functional obsolescence of older buildings lacking modern specs.
8. Hospitality Outlook: Choppy but Investable
The hospitality sector will continue to reflect macroeconomic cycles, travel patterns, and demand segmentation.
Hospitality 2026–2030 Themes
Segment bifurcation: Luxury and experience‑oriented travel will outperform mid‑scale chains under pressure from expense growth.
Development slowdown: Higher financing costs constrain new hotel construction, benefiting existing assets once demand stabilizes.
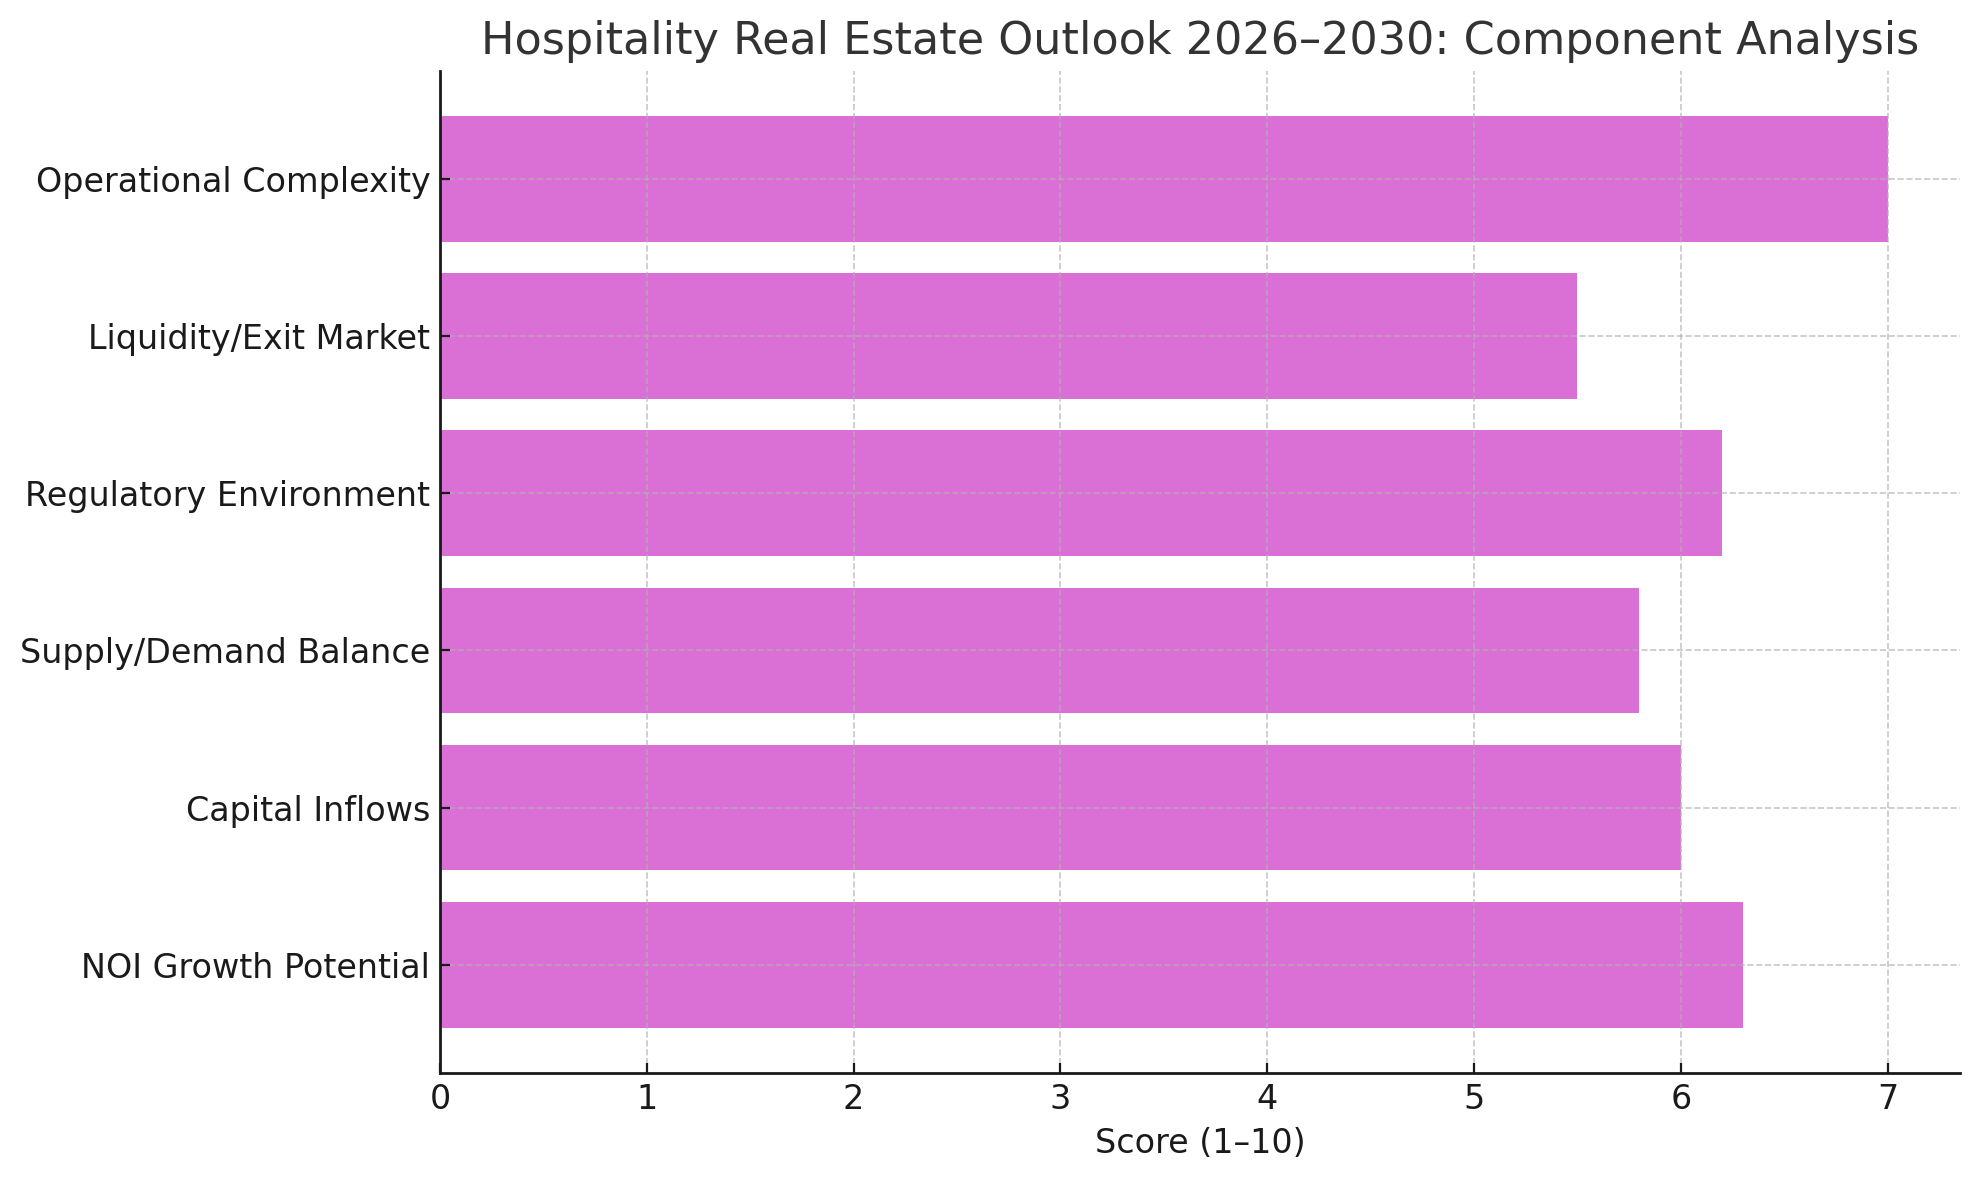
Here’s the Hospitality Real Estate Outlook (2026–2030) component analysis:
Operational Complexity scores highest due to labor intensity and margin management requirements.
Liquidity and Capital Inflows are modest as the sector is highly cyclical and sensitive to macro shocks.
NOI Growth depends heavily on event calendars, travel trends, and cost pressures.
Drivers to Watch:
Economic cycles affecting travel/discretionary spend.
Large‑event and group travel calendars.
Insurance and labor expense trends.
9. Scattered‑Site SFR Portfolios: Fragmented, Yet Growing
Single‑family rental portfolios remain attractive, but the market is inherently fragmented.
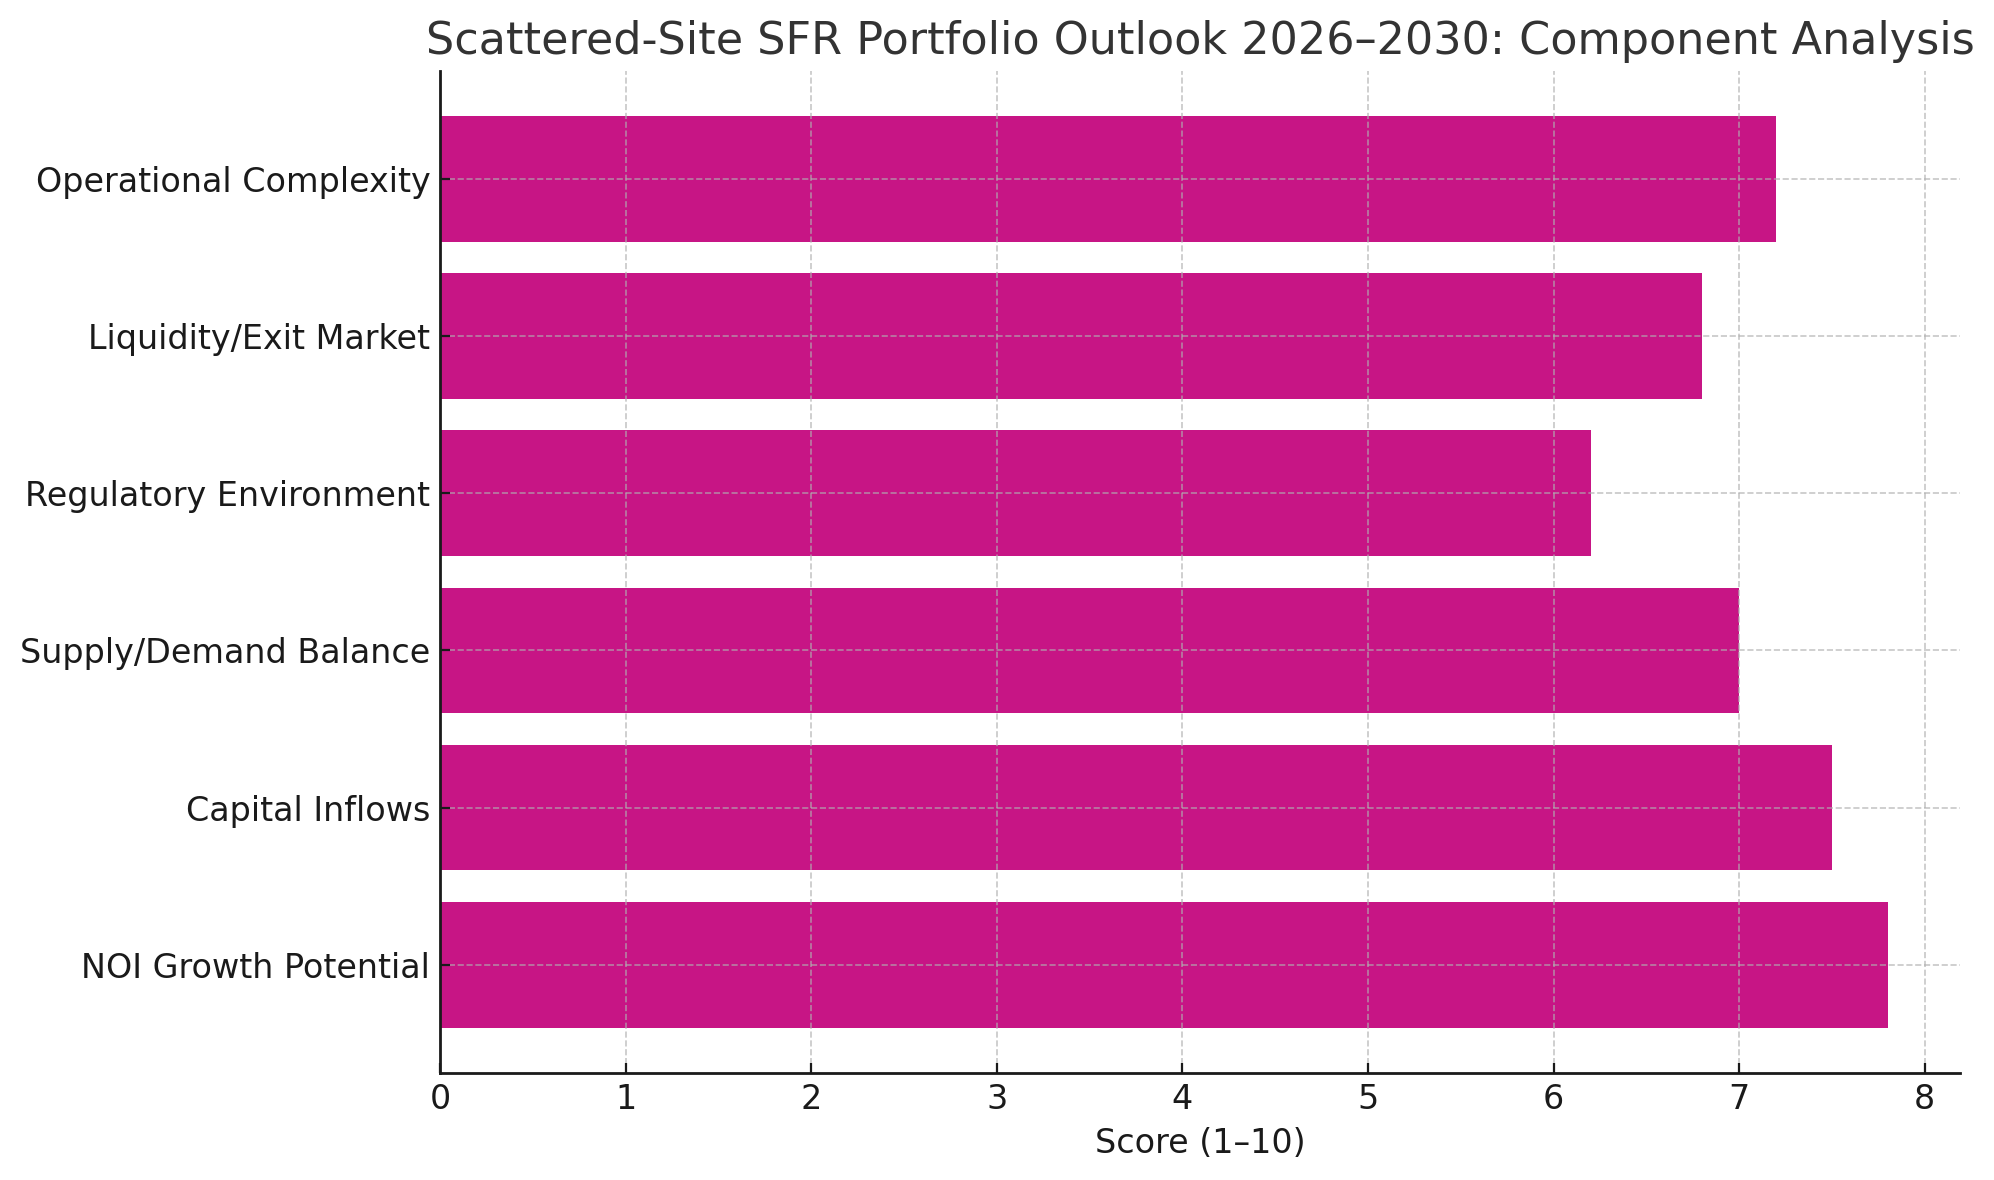
Here’s the Scattered-Site Single-Family Rental (SFR) Portfolio Outlook (2026–2030) broken down by performance components:
NOI Growth Potential and Operational Complexity score well due to sustained demand and growing tech-enabled management models.
Capital Inflows are solid but more selective than in institutional BTR.
Regulatory Environment introduces scaling friction in jurisdictions limiting institutional ownership.
Growth Factors:
Homeownership affordability constraints.
Appetite for rental product with low entry friction.
Operational Drivers:
Maintenance routing efficiencies.
Tech‑enabled resident service models.
Risks:
Local regulatory restrictions on institutional SFR ownership.
10. Self Storage: Data‑Driven and Locally Sensitive
Self storage remains a mature CRE sector supported by life events, mobility trends, business storage needs, and household formation dynamics.
Performance Outlook:
Near‑term rent growth may be muted where supply is elevated.
Over five years, steady performance returns as fundamentals balance.
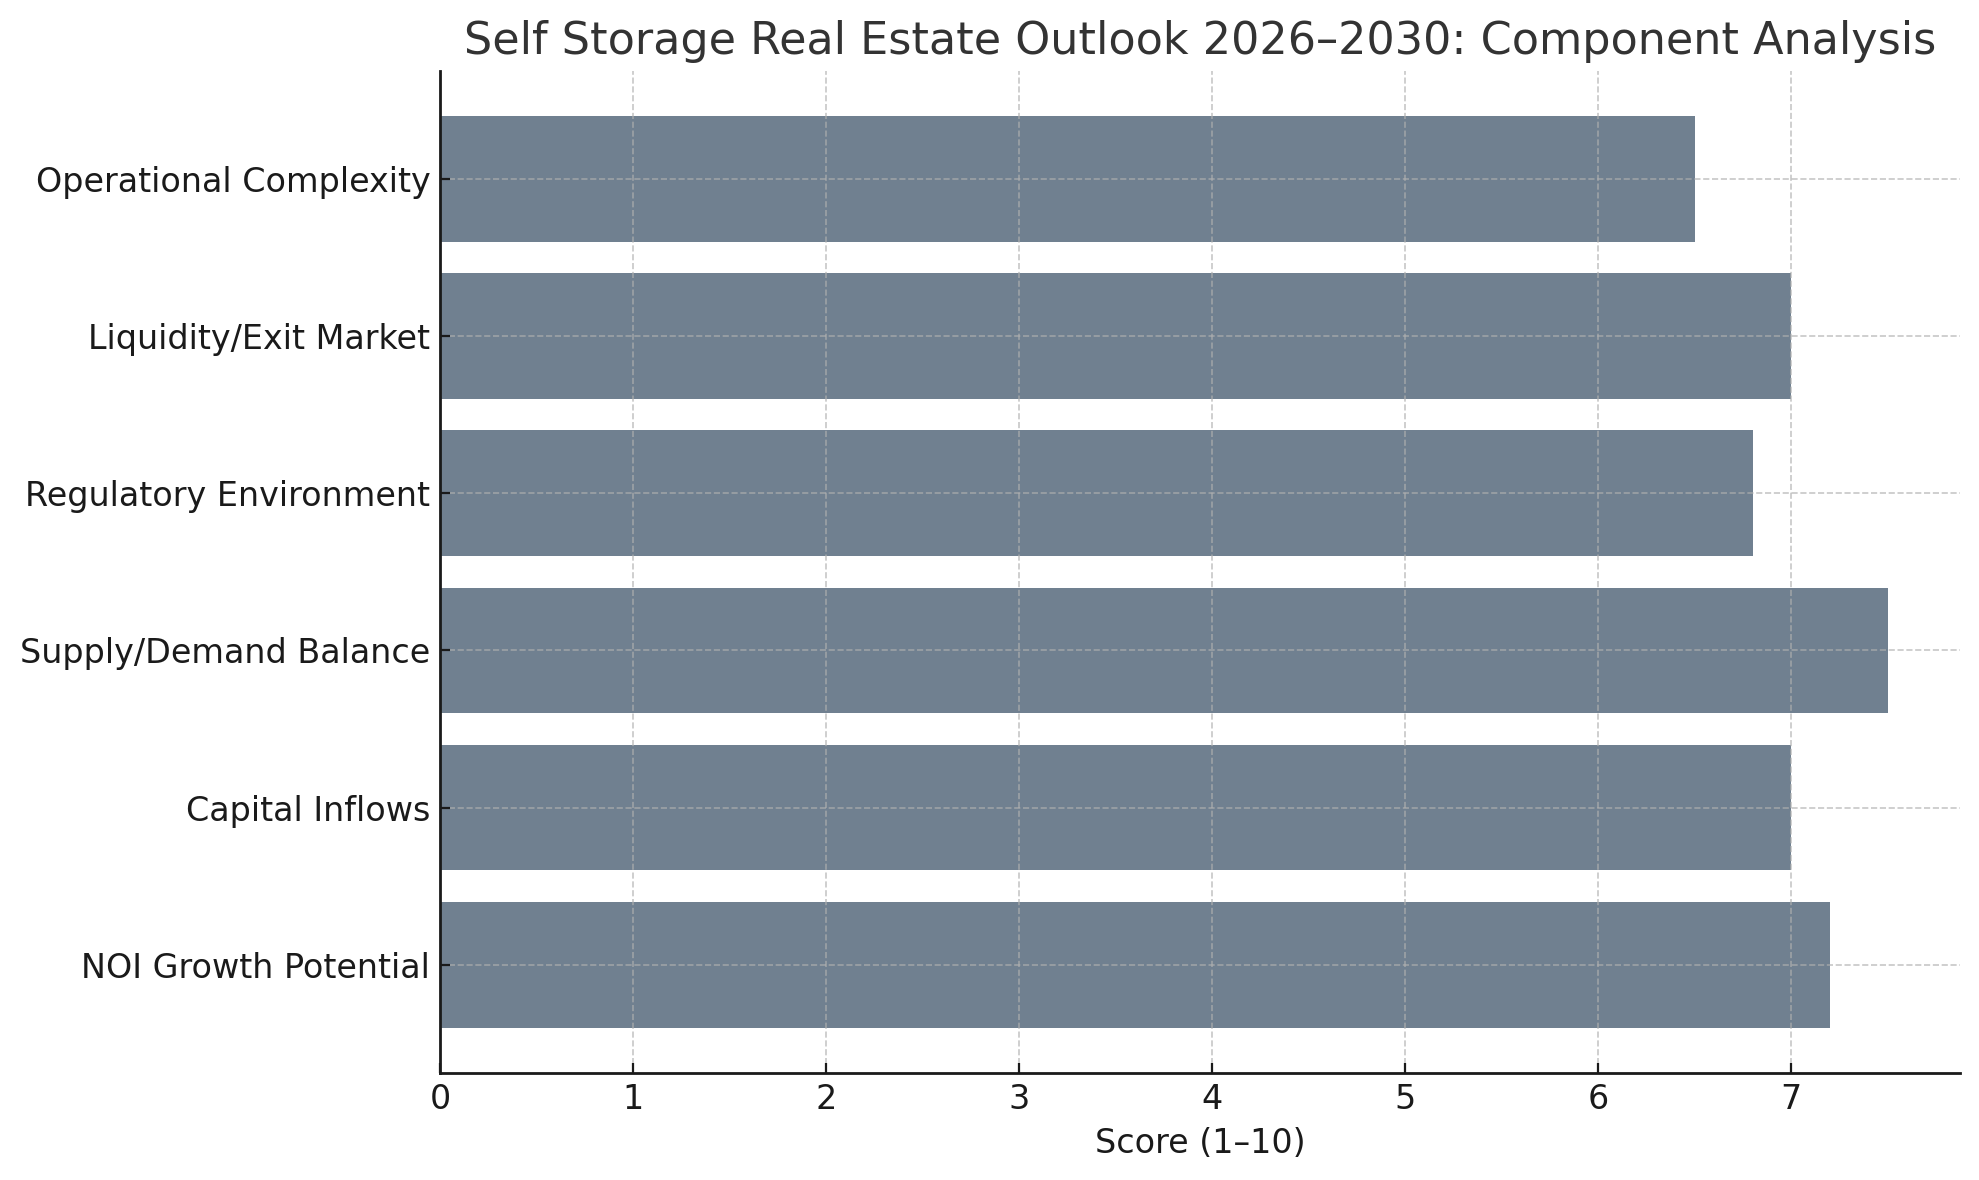
Here's the Self Storage Real Estate Outlook (2026–2030) by component:
Supply/Demand Balance and NOI Growth Potential are strong, especially in markets with disciplined development.
Capital Inflows remain stable as institutional interest grows in this niche, data-driven sector.
Operational Complexity is relatively low, contributing to consistent performance.
Key Driver:
Market‑level supply discipline — strong local supply control leads to solid performance.
11. How Lenders & Investors Should Position for 2026–2030
Across all sectors, prudent capital deployment and risk management are paramount. Below are strategic imperatives:
1) Capital is Not Free Again
Underwrite with conservative exit caps, realistic amortization, and real capex forecasts. Favor durable cash flow sectors like:
Industrial logistics
Necessity retail
Housing & BTR
Avoid over‑leveraging on story deals without substantiated financials.
2) Underwrite Local Policy & Micro Location Risk
Local rules — from rent regulation to entitlement regimes — will dominate returns in:
Multifamily and BTR markets
Office conversion prospects
Treat local policy as a first‑class risk factor.
3) Build Playbooks for the Maturity Wall
Expect:
Loan extensions
Preferred equity layers
A/B note structures
Active loan sales
Lenders should segment borrowers based on equity cushion and extension risk appetite.
4) Target Modernization Arbitrage
Identify opportunities where modernization adds value:
Industrial: ESFR systems, trailer/storage yards, automation readiness.
Office: HVAC/MEP, wellness features, amenity upgrades.
Retail: Last‑mile logistics enhancements, service tenancy build‑outs.
5) Maintain Dry Powder for Volatility
Trade policy shifts can disrupt logistics demand and retail lease patterns. Having capital ready for momentary dislocations allows opportunistic entry and scaling.
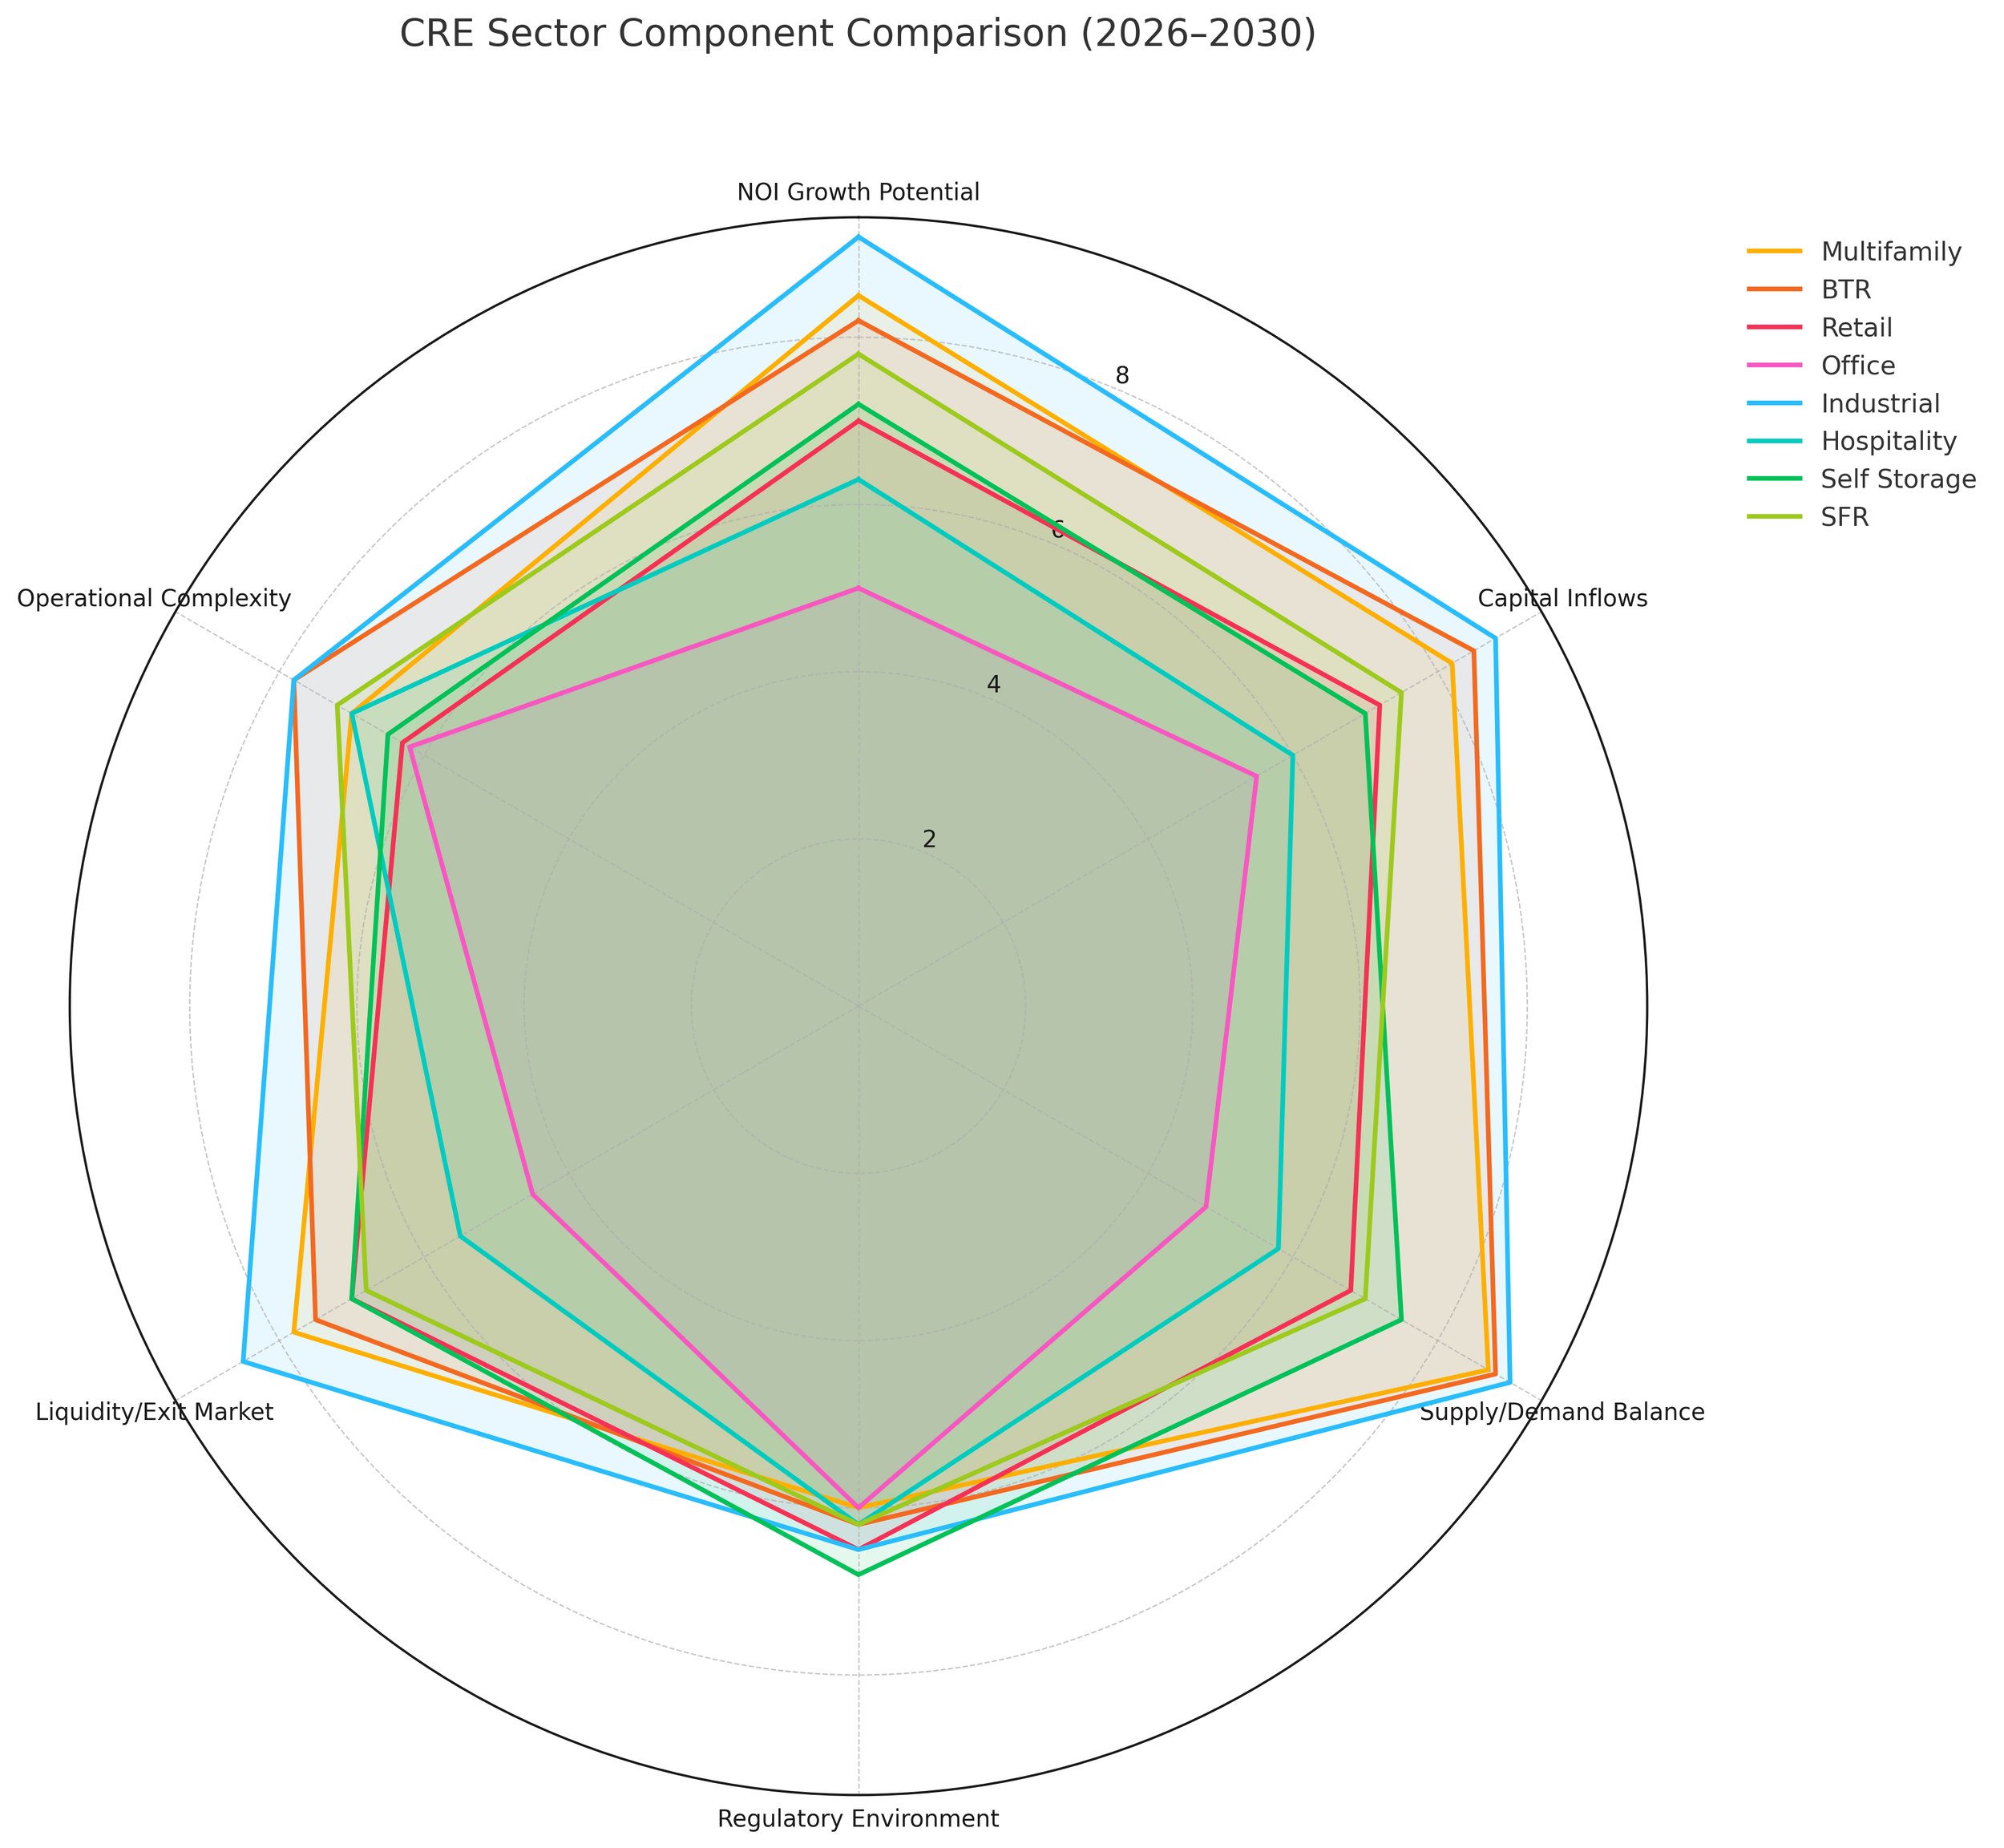
CRE Sector Component Comparison (2026–2030)
This radar chart offers a visual comparison of eight major commercial real estate (CRE) sectors based on their performance outlook across six fundamental components for the 2026–2030 cycle. Each axis represents a key dimension of real estate performance, with sector scores normalized on a 1–10 scale, where 10 reflects optimal strength or stability.
Scoring Components Explained
NOI Growth Potential
Projected net operating income performance, influenced by rent growth, absorption, and operational margin.Capital Inflows
Likelihood and volume of institutional capital targeting the sector, reflecting investor sentiment and scalability.Supply/Demand Balance
Market-level balance between new supply and expected demand, factoring in construction pipelines and absorption trends.Regulatory Environment
Impact of local policy, including zoning, rent control, tax treatment, and entitlement risk.Liquidity / Exit Market
Expected ease of transacting and refinancing, considering market depth, buyer interest, and valuation certainty.Operational Complexity
Difficulty of managing and scaling assets due to maintenance, tenant diversity, labor exposure, and margin sensitivity.
Sector-by-Sector Insights
Industrial scores highest overall, driven by exceptional NOI growth, strong capital flows, and structural demand from nearshoring and automation. It leads across five of six categories.
Multifamily and Build-to-Rent (BTR) rank just below industrial, with robust demand, improving liquidity, and a relatively favorable outlook on capital access. BTR scores slightly higher in capital inflow and operational leverage.
Retail shows a balanced profile, bolstered by necessity-based formats and limited new supply. Its regulatory and operational exposure keeps scores moderate.
Self Storage and Scattered-Site SFR offer consistent performance across the board, particularly in supply-demand alignment and operational efficiency. These are emerging core-plus sectors for many investors.
Hospitality reflects mixed potential with above-average operational complexity and volatility in capital inflow and liquidity.
Office ranks lowest overall due to structural vacancy, muted demand, and high capital expenditure requirements. However, it remains competitive in specific niches (e.g., conversions or Class A assets).
12. Conclusion: CRE in Transition — Where to Focus for Long‑Term Gains
The 2026–2030 period in commercial real estate will be defined by strategic differentiation, local market analysis, and disciplined capital allocation. While macro conditions like interest rates, policy shifts, and demographic trends will influence overall performance, the winners will be those investors and lenders who:
Underwrite realistic fundamentals.
Prioritize quality assets with durable demand.
Navigate local policy and regulatory headwinds.
Embrace modernization and operational excellence.
Whether you’re focused on multifamily growth, build‑to‑rent expansion, industrial logistics, or sector rotation, the next five years will reward data‑driven strategy and patient capital.
FAQs
-
The outlook for commercial real estate (CRE) from 2026 to 2030 is one of cautious normalization across most sectors. Multifamily and build-to-rent (BTR) are expected to benefit from household formation and homeownership constraints, while industrial real estate continues to grow due to reshoring and logistics demand. Office markets remain bifurcated, retail is polarized between necessity-based and discretionary formats, and self storage and hospitality offer selective opportunities. Interest rates, local policy, and refinancing pressures will significantly influence outcomes.
-
Top-performing CRE sectors through 2030 are likely to include:
Industrial logistics and light manufacturing, driven by nearshoring and e-commerce.
Multifamily housing, especially newer, energy-efficient properties.
Build-to-rent (BTR) communities in growth corridors.
Necessity-based retail, such as grocery-anchored centers and service-tenanted strip malls.
These sectors are supported by long-term demographic trends, policy tailwinds, and durable tenant demand.
-
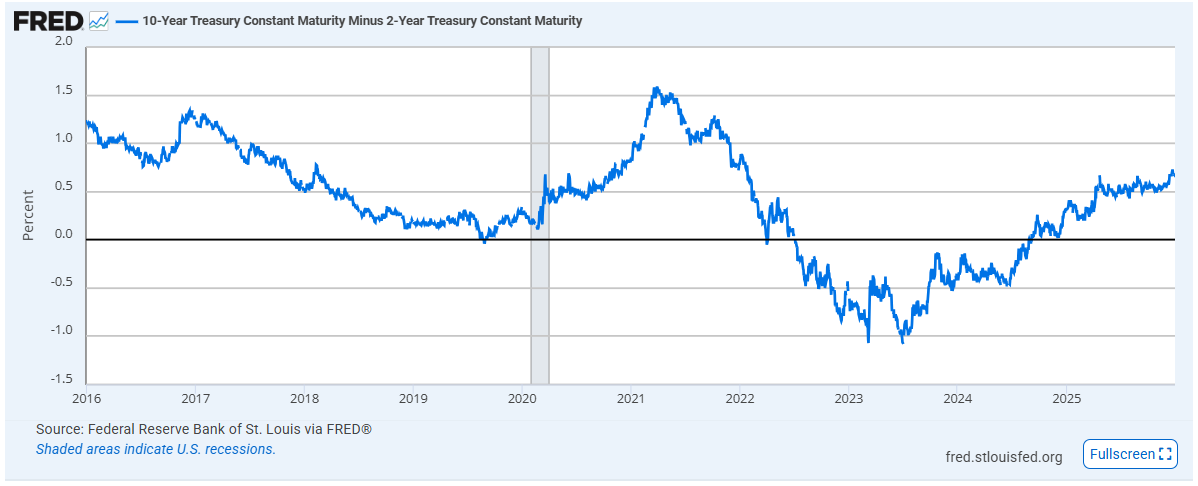
Higher-for-longer interest rates will challenge many CRE owners facing a large wave of loan maturities in 2026–2027. Although the short-end of the yield curve is expected to decrease in 2026, don’t expect much movement in the 10-30 year treasuries until 2027-2028, if at all. Refinancing feasibility will depend on debt service coverage ratios (DSCR), asset quality, and market liquidity. Cap rates may remain elevated relative to historical norms, compressing valuations—especially for older or undifferentiated assets. Investors should prepare for selective distress, recapitalizations, and greater private credit involvement.
-
Key risks in the 2026–2030 CRE cycle include:
Refinancing difficulty due to elevated debt costs and cap rate mismatches.
Local regulation, especially in housing markets with expanding rent control.
Commodity B/C office demand erosion and zombie buildings.
Supply/demand imbalances in industrial and self storage markets from overbuilding.
Geopolitical and tariff-induced volatility affecting trade and logistics hubs.
Mitigating these risks requires localized underwriting, policy tracking, and strong asset management.
-
Successful CRE strategies through 2030 include:
Underwriting with conservative exit assumptions and amortization.
Targeting assets with modernization upside (e.g., HVAC, power, automation).
Building playbooks for loan maturity scenarios, including extensions and note sales.
Prioritizing durable cash-flow sectors like housing, industrial, and necessity retail.
Avoiding “story-driven” assets lacking strong fundamentals or tenant demand.
Strategic capital deployment, local expertise, and dry powder for dislocation moments will be critical.