
Return on Cost vs Yield on Cost
Read to the end. There is a great video that breaks down the value of these metrics in Development & Value-Add deals.
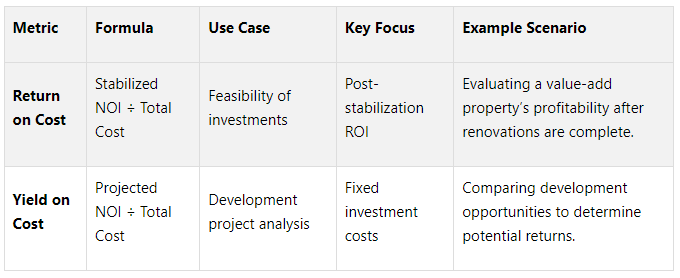
Return on Cost (ROC) and Yield on Cost (YoC) are two metrics used in commercial real estate to measure how well an investment performs relative to its cost. While they are similar, they serve slightly different purposes:
Return on Cost (ROC): Measures the profitability of a project after stabilization. Formula: Stabilized Net Operating Income (NOI) ÷ Total Project Cost.
Yield on Cost (YoC): Focuses on the return relative to the total capital invested in a project. Formula: Projected Stabilized NOI ÷ Total Project Cost.
Both metrics are helpful for comparing investment opportunities, especially in development or value-add projects, where the goal is to assess the potential return versus the risks involved.
Key Takeaways:
ROC is forward-looking and evaluates the efficiency of investments after stabilization.
YoC is often used for quick comparisons of development projects and focuses on fixed costs.
Both metrics differ from cap rates, as they are based on actual project costs rather than market value.
Quick Comparison:
Both metrics are valuable tools but should be paired with broader market analysis to account for risks like cost overruns or shifts in rental income.
Understanding Return on Cost
Definition and Formula
Return on Cost (ROC) measures the anticipated annual yield of a real estate development or value-add project once it reaches stabilization. The formula is straightforward: Stabilized Net Operating Income (NOI) ÷ Total Project Cost.
The total project cost includes all expenses, such as the purchase price and any development or renovation costs [8]. ROC primarily focuses on the pro forma, post-stabilization cap rate, which reflects the expected performance of the property after construction is completed and it is leased at market rates [8]. This metric helps investors assess whether a development project is worth pursuing by projecting its profitability once stabilized.
How It's Used in Commercial Real Estate
In commercial real estate (CRE), ROC plays a key role in evaluating projects where future performance is crucial. It is especially valuable for analyzing capital-intensive investments like value-add properties or new developments [8].
For example, imagine acquiring a self-storage facility in Boston with a stabilized NOI of $20,000. If the purchase price is $200,000 and renovation costs are $50,000, the total project cost is $250,000. The ROC in this case would be 8.0% ($20,000 ÷ $250,000). If similar properties in the area are trading at a 6.5% market cap rate, the 1.5% development spread indicates the project could be profitable [8].
Dave Welk, Managing Director of Acquisitions at Origin Investments, highlights the practical value of ROC:
“Return on cost is a forward-looking cap rate; it takes into consideration both the costs needed to stabilize the property and the future NOI once the property has been stabilized. It’s calculated by dividing the purchase price by the potential NOI. We use return on cost to determine if we’ll potentially generate an income stream greater than what we could achieve if we purchased a stabilized asset today.”
ROC is particularly useful for properties with unstable cash flows, such as those undergoing significant renovations or development. In these cases, traditional cap rates may not provide an accurate picture of potential returns [9].
What Affects Return on Cost
Several factors can influence ROC, starting with construction costs, which often vary due to changes in material prices and labor rates. Rental income also plays a major role, as it directly impacts stabilized NOI. Additionally, operating expenses can significantly affect the actual returns. Broader market conditions, including shifts in demand and economic trends, further influence both revenue and costs.
For real estate investors, a solid ROC generally falls between 8% and 10% [7]. Take, for instance, an apartment development project with a projected stabilized NOI of $1,500,000 and a total project cost of $23,000,000. In this case, the ROC would be 6.52% [12].
However, it’s essential to account for risks such as leasing challenges, execution issues, and potential construction delays or cost overruns when analyzing ROC [10]. Recent market trends illustrate the importance of these considerations. By 2024, industrial properties were the only sector in commercial real estate to deliver positive ROI, while the average real estate sector saw a 6.7% decline, and office properties experienced an 8% year-over-year drop as of October 2024 [11]. Understanding these variables is crucial for accurately forecasting a project’s performance and aligning it with investment objectives.
Understanding Yield on Cost
Definition and Formula
Yield on Cost (YoC) is a key metric in commercial real estate that estimates the potential annual return on a development or value-add project. It’s calculated by dividing the projected stabilized Net Operating Income (NOI) by the total project cost [13]. Sometimes referred to as the going-in cap rate, development yield, cost cap rate, or build-to rate [1], YoC differs from traditional cap rates because it focuses on the actual total cost invested in the project rather than the current market value [1]. This distinction makes YoC particularly relevant for evaluating development projects.
How It's Used in Commercial Real Estate
YoC is a practical tool for developers to quickly evaluate and compare investment opportunities, especially in property development [13]. Take, for instance, a land development project with a total cost of $40 million. If the projected effective gross income at stabilization is $5 million and operating expenses are $2.6 million, the stabilized NOI would be $2.4 million. This results in a YoC of 6.0% ($2.4 million ÷ $40 million) [13].
To make informed decisions, developers often analyze multiple deals side by side using YoC. Here’s an example of how different opportunities might stack up:
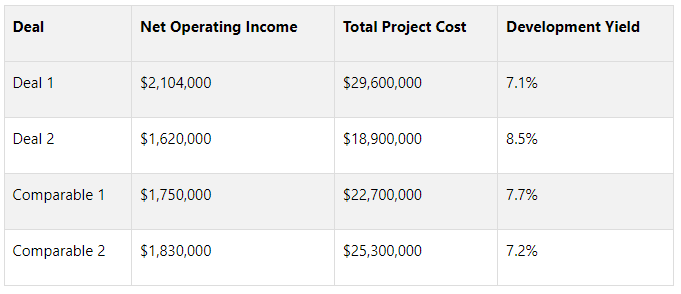
Developers generally aim for a development spread - 150 to 250 basis points above market cap rates - to account for the higher risks associated with development projects [1].
What Affects Yield on Cost
Several factors can influence YoC calculations beyond just cash inflows. Fluctuations in material and labor costs can significantly alter the total project cost [5]. Rental rates, which hinge on accurate market research and forecasting, are another critical variable. Additionally, operating expenses - such as management fees, maintenance, insurance, and taxes - play a vital role in shaping the stabilized NOI. Broader market conditions can further impact revenue potential and cost structures [5].
YoC can be calculated in two ways: trended or untrended. A trended YoC accounts for expected NOI growth over time, while an untrended YoC uses only the stabilized NOI without factoring in future changes. This distinction is particularly relevant for properties in rapidly appreciating markets or those with built-in rent escalations [5].
A higher YoC typically signals a more appealing investment, but it’s crucial to weigh projected returns against potential risks. When paired with thorough market analysis, YoC becomes a powerful tool for evaluating a project’s ability to weather market changes and unexpected costs. These insights make YoC a valuable metric for developers and investors when making underwriting decisions [5][6].
Return on Cost vs Yield on Cost: Main Differences
How the Definitions and Formulas Compare
Building on their definitions, let's compare Return on Cost and Yield on Cost. While these terms are sometimes used interchangeably in commercial real estate, their formulas and purposes are nearly identical [2][1]. Both metrics measure the profitability of a real estate investment relative to its cost, making them valuable tools for assessing whether a project is worth pursuing [5].
The key similarity is that both metrics use Net Operating Income (NOI) in the numerator. The distinction lies in the denominator: one refers to Total Project Cost, while the other uses Total Investment Cost [2][3]. In practice, these terms represent the same thing - they include all expenses involved in acquiring, developing, or improving a property.
Yield on Cost is often associated with development or value-add projects, where the focus is on returns relative to the total capital invested in creating or improving a property [1].
Next, let’s dive into the strengths and weaknesses of each metric.
Pros and Cons of Each Metric
Both metrics come with their own set of benefits and drawbacks.
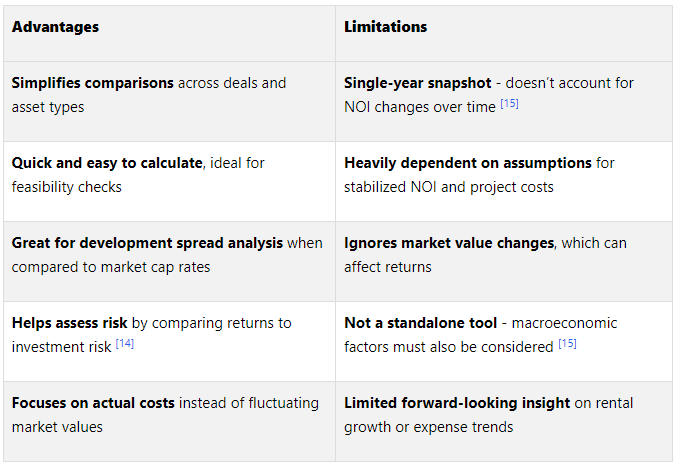
The biggest limitation of both metrics is their reliance on a single year's NOI. This approach doesn’t account for potential shifts in rental income, vacancy rates, or operating expenses over the holding period [15]. As a result, these metrics are less effective for long-term investment analysis unless paired with other tools.
Yield on Cost shines in evaluating whether the projected returns justify the associated risks, especially in value-add or opportunistic projects involving capital improvements [14]. However, the reliance on stabilized NOI projections and estimated project costs introduces a layer of uncertainty into the calculations.
When to Use Each Metric
Choosing between Return on Cost and Yield on Cost often depends on the type of project and industry norms.
Yield on Cost is most useful for development and major repositioning projects. Real estate developers and value-add investors prioritize this metric when assessing capital-intensive projects, as it focuses on the future income potential of a stabilized property [8]. It’s particularly helpful for deal comparisons because it centers on fixed project costs [6].
Return on Cost works well for evaluating the overall feasibility of property investments, whether through value-add strategies or ground-up development [8]. This metric helps determine if a project offers an acceptable balance of risk and return [8].
Both metrics become more insightful when paired with market analysis. For example, developers often target a development spread of 150–250 basis points above market cap rates when using these metrics, accounting for the additional risks tied to development projects [1]. This comparison helps investors decide if the projected returns adequately compensate for those risks.
One major advantage of both metrics over traditional cap rates is their focus on actual investment costs rather than fluctuating market values. Yield on Cost emphasizes fixed costs, while cap rates are tied to market conditions [6]. This makes Return on Cost and Yield on Cost particularly useful for evaluating how efficiently capital is being deployed, rather than simply looking at current market performance.
In commercial real estate, aligning your choice of metric with the project type can provide sharper insights. Development-focused discussions often lean on Yield on Cost, while broader investment analyses may favor Return on Cost. Either way, both metrics help illuminate how effectively capital is being used.
Transform Your Real Estate Strategy
Access expert financial analysis, custom models, and tailored insights to drive your commercial real estate success. Simplify decision-making with our flexible, scalable solutions.
How These Metrics Work in U.S. CRE Analysis
Using These Metrics in Underwriting and Asset Management
Return on Cost and Yield on Cost play a key role in making informed decisions throughout the lifecycle of a commercial real estate (CRE) investment. From the early stages of deal evaluation to ongoing asset management, these metrics provide clarity. Yield on Cost, for example, offers a quick way to gauge whether a deal is worth pursuing [14]. Meanwhile, Return on Cost helps determine if the income potential of a value-add property justifies the investment compared to buying a fully stabilized asset [9].
Take this scenario: An investor is eyeing an office building priced at $1,000,000. They project a stabilized Net Operating Income (NOI) of $100,000 and expect to incur $125,000 in additional expenses. This results in a Yield on Cost of 8.89%, which, when compared to a market cap rate of 7.00%, delivers a development spread of 1.89%. This example illustrates how these metrics come into play during underwriting, laying the groundwork for understanding how broader market conditions might influence their performance.
How U.S. Market Conditions Affect These Metrics
The U.S. commercial real estate market is heavily influenced by economic shifts, particularly interest rate changes. Since CRE investments often rely on leverage, fluctuations in interest rates can directly impact borrowing costs and, by extension, these performance metrics [16]. A recent example is the 2020–2023 interest rate cycle. In 2020, rates dropped to near zero, fueling a 76% surge in transaction volumes by 2021. However, as rates increased in 2023, deal activity saw a sharp decline [16].
Cap rates, which reflect property valuations, typically adjust more slowly than interest rates. This lag often leads to temporary pricing inefficiencies, with many market participants opting to hold off on transactions until conditions improve [16]. Lower borrowing costs allow investors to pay higher prices for properties without compromising returns [16], while rising rates tend to drive property values downward [17]. Because cap rates are influenced by the risk-free rate plus a spread, closely monitoring both short- and long-term yield curves is essential [16].
In this constantly shifting landscape, having the right tools to apply these metrics is critical for success.
How The Fractional Analyst Helps

The Fractional Analyst Home Screen
The Fractional Analyst simplifies the process with tailored financial analysis services designed for CRE professionals. It provides on-demand underwriting support, combining advanced financial modeling with comprehensive market analysis.
With custom tools and dashboards, users can track key metrics throughout the investment lifecycle. The platform integrates seamlessly with tools like QuickBooks and Excel [18], making it easier to manage data and monitor performance. It also offers detailed investor and lender reporting, ensuring property performance is communicated clearly and aligned with initial projections. This transparency helps maintain stakeholder trust and supports future fundraising efforts.
The Fractional Analyst also keeps calculations for Return on Cost and Yield on Cost up-to-date by factoring in current market trends, such as shifts in cap rates, construction costs, and leasing activity. Flexible pricing options make these sophisticated analysis tools accessible to firms of all sizes, with monthly subscriptions starting at $300 per user and one-time model purchases ranging from $3,000 to $6,000 [19]. This ensures that even smaller firms can benefit from high-quality financial insights.
Analyzing the Yield on Cost in Development and Value-Add
Conclusion
Understanding the distinction between Return on Cost (ROC) and Yield on Cost (YOC) is essential for making informed decisions in commercial real estate (CRE). These metrics serve as tools for evaluating whether the potential returns of an investment are worth the risks, particularly in value-add or development projects [1][8]. A strong yield on cost generally surpasses the market cap rate by 150 to 200 basis points [4], highlighting the development spread and aiding in a well-rounded risk-reward assessment.
“Yield on Cost is a ratio that measures investment efficiency. It compares a property’s stabilized net operating income to its total project cost.”
While yield metrics are valuable, they shouldn’t stand alone. To get a clear picture, investors should pair them with other financial indicators like occupancy rates, cash flow, and internal rate of return (IRR). This broader approach provides a more complete analysis, ensuring decisions are based on multiple data points rather than a single metric [4]. Together, ROC and YOC are key elements of a robust CRE investment strategy.
Additionally, tools like what we are building at The Fractional Analyst enhance this process by offering integrated financial modeling and real-time dashboards. These features simplify the calculation and tracking of these metrics throughout the investment lifecycle.
“Use yield and return together to evaluate an investment’s overall performance.”
FAQs
-
Return on Cost (RoC) and Yield on Cost (YoC) serve different purposes than cap rates, both in how they're calculated and what they reveal. A cap rate evaluates a property's annual net operating income (NOI) as a percentage of its current market value. On the other hand, RoC and YoC focus on how a property's income stacks up against its total investment cost, which includes expenses like acquisition or development.
Cap rates are great for providing a quick look at a property's performance based on its market value, making them ideal for comparing existing properties. In contrast, RoC and YoC are more forward-focused, highlighting how efficiently investment costs are being used and the potential profitability of a project over time. This makes RoC and YoC especially useful when analyzing new developments or properties undergoing major upgrades.
-
When choosing between Return on Cost (RoC) and Yield on Cost (YoC), the decision depends heavily on your investment goals and the stage of the project.
RoC focuses on how effectively a property generates income by comparing its net operating income (NOI) to the total development cost. This metric is particularly helpful for stabilized properties where the primary concern is how well the property is performing in terms of income generation.
In contrast, YoC evaluates the annual return relative to the total development cost, while also taking market trends and growth expectations into account. This makes it especially relevant during the development phase, as it provides insights into potential future returns.
When deciding which metric to prioritize, consider the project's current phase, prevailing market conditions, and whether your emphasis is on assessing immediate income performance or gauging long-term profitability.
-
Market conditions, particularly shifts in interest rates, play a crucial role in shaping the usefulness of Return on Cost (RoC) and Yield on Cost (YoC) metrics in real estate analysis. When interest rates climb, borrowing becomes pricier, often driving down property values and dampening demand. In such scenarios, YoC may appear less attractive if rental income doesn’t rise enough to balance out the higher expenses.
Meanwhile, RoC might seem more stable since development costs are typically fixed. However, increased financing costs can still eat into overall profitability. During times of rising interest rates, both RoC and YoC may lose some of their reliability as investment evaluation tools, as they don’t fully capture external factors like financing pressures or market fluctuations.