Best Practices for Investor Reporting in CRE
Investor reporting in commercial real estate (CRE) is all about trust, transparency, and timely communication. Here's a quick guide to create effective reports that keep investors informed and confident:
Start with Property Details: Include location, size, type, and unique features, plus reasons for acquisition and strategic benefits.
Financial Performance: Share key documents like income statements, balance sheets, and cash flow statements. Highlight metrics like NOI (Net Operating Income), Cap Rate, and IRR (Internal Rate of Return).
Portfolio Updates: Summarize acquisitions, sales, tenant changes, and market shifts. Be clear about successes and challenges.
Transparency Matters: Balance good news with setbacks, provide variance analysis, and meet legal disclosure standards.
Consistency is Key: Stick to a reporting schedule (quarterly or monthly) and tailor content for different audiences - like institutional investors or retail investors.
Leverage Technology: Use automation and analytics tools to streamline reporting, reduce errors, and offer deeper insights.
Quick Tip: Use visuals like charts and summaries to simplify complex data, and always prioritize clarity over jargon.
Investor reporting isn’t just about numbers - it’s about building strong, lasting relationships by keeping communication clear and consistent.
3 IMPORTANT Real Estate Investment Metrics You're Probably Not Using [But Should]
Key Components of CRE Investor Reports
Creating an effective investor report means including specific elements that together provide a full picture of your property's performance and strategic direction. Each section plays a part in building investor trust and supporting informed decisions.
Property Details
The property details section serves as the cornerstone of any investor report. This section should include static, easy-to-access data. Start with the essentials: property location, square footage, property type, and standout features that make the property appealing to both tenants and investors.
Go beyond the basics by summarizing the reasons for acquisition and the strategic advantages the property brings to the table. Highlight details about the surrounding area, key tenants, lease structures, and unique characteristics that set the property apart. Include physical specifics like parking availability, amenities, and recent upgrades - these factors directly influence financial outcomes. The aim here is to give investors a clear understanding of what they own and why it holds value in the current market.
Financial Statements and Metrics
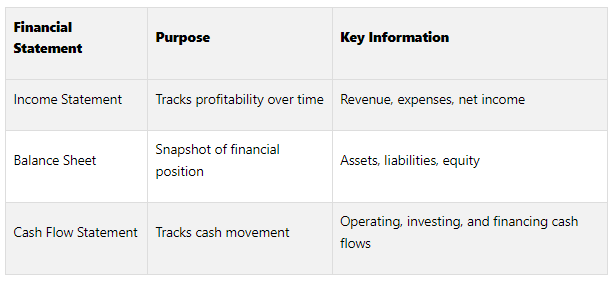
Once you've covered the property basics, financial details complete the picture. Financial statements are essential for outlining the asset's performance and overall financial health. Every CRE investor report should include these three key financial documents: income statement, balance sheet, and cash flow statement.
The income statement provides an overview of revenues, expenses, and net income during the reporting period.
The balance sheet offers a snapshot of assets, liabilities, and equity at a specific point in time, giving a clear view of the property's financial standing.
The cash flow statement details the cash inflows and outflows, helping investors understand liquidity and distribution potential.
In addition to these statements, include essential performance metrics. Net Operating Income (NOI) reflects profitability by subtracting operating expenses from revenue. Capitalization Rate (Cap Rate) gives insight into the expected rate of return on the investment. Internal Rate of Return (IRR) helps evaluate the long-term profitability of the asset, while Equity Multiple measures the total return on investor equity. Operational metrics like occupancy rates, tenant turnover, average rent per square foot, and lease renewal rates add context to the numbers.
When presenting this data, focus on transparency and organization. For example, compare your property's NOI to similar properties to show whether it’s performing above or below market standards. Use Cap Rate comparisons to highlight how the investment fares in terms of risk-adjusted returns.
Portfolio Updates and Business Highlights
The portfolio updates section should bring together key highlights. Summarize major deals, transactions, and opportunities, alongside current portfolio valuations, in a concise and structured format.
Focus on notable events during the reporting period, such as acquisitions, sales, renovations, lease signings, and tenant departures. Be transparent about both successes and challenges. If there are setbacks, outline alternative strategies and action plans.
Additionally, provide updates on market conditions, regulatory changes, and competitive shifts impacting your properties. Investors value insights into how external factors influence performance and what management anticipates for the future. Regular updates on both wins and challenges help ensure investors are well-informed about decisions affecting their returns. This level of transparency plays a key role in earning and maintaining investor trust.
Best Practices for Transparency and Trust
Investor trust strengthens when reports address both achievements and challenges with clarity and honesty.
Balanced Reporting
A trustworthy investor report doesn’t shy away from discussing setbacks - it provides context and actionable steps to address them. For example, if occupancy rates drop significantly, explain the reasons behind the decline, outline your recovery strategy, and include a timeline for improvement. This approach reassures investors that challenges are being actively managed.
Use straightforward language that all investors can understand. When technical terms are unavoidable, make sure to define them in plain terms. For instance, instead of saying, "NOI compression due to elevated OpEx", clarify with, "Net Operating Income fell by 8% this quarter because of higher maintenance costs, including HVAC system repairs."
A great example of balanced reporting comes from Origin Investments’ Q3 2017 quarterly performance report. They addressed three key questions for every investment: What was the original plan? How is the plan performing compared to expectations? What’s the guidance for the future? This structure ensures investors get a clear picture of both progress and accountability.
Once you’ve established this balance, variance analysis can add numerical depth to your reporting.
Variance Analysis
Variance analysis takes performance reporting a step further by breaking down the differences between projections and actual outcomes. It turns raw numbers into actionable insights, helping investors understand the story behind the data. For example, if an investment was expected to yield a 12% internal rate of return (IRR) but is currently tracking at 9.5%, explain the factors contributing to this gap, such as slower-than-expected market rent growth or unexpected capital expenditures.
Present these comparisons in a clear, structured format. Use columns to list items, the forecasted and actual values, and the variances. Include both dollar amounts and percentage changes to give investors a complete perspective. Adding explanatory notes to highlight key variances is essential, especially when they significantly affect overall performance.
Additionally, it’s important to provide guidance on cash flow. If refinancing delays or capital improvement projects might impact distribution timing, communicate these changes early so investors can plan accordingly.
Regulatory Compliance
Transparency isn’t just about numbers - it’s also about meeting legal and industry standards. Adhering to regulatory requirements builds credibility and protects both investors and sponsors. For example, Real Estate Investment Trusts (REITs) are required to disclose detailed information about their properties, such as locations, types, and financial performance, to shareholders. Private investments can also enhance trust by following similar disclosure practices.
Collaborating with experienced securities attorneys and real estate fund consultants ensures your reporting aligns with legal requirements. Federal anti-fraud provisions mandate that offering documents and investor communications must not contain material misstatements or omit critical information.
When making projections - such as forecasting rent growth or market trends - always provide the assumptions behind these estimates and clearly outline the risks that could impact the outcomes. Include appropriate disclaimers to manage expectations.
Organize reports to flow logically, starting with high-level summaries and drilling down into detailed data. Use well-labeled tables and charts to make complex information easier to digest. Meeting these standards not only fulfills legal obligations but also reinforces the credibility and professionalism of your reports.
Transform Your Real Estate Strategy
Access expert financial analysis, custom models, and tailored insights to drive your commercial real estate success. Simplify decision-making with our flexible, scalable solutions.
Reporting Schedule and Customization
Establishing a consistent reporting schedule and format is crucial for keeping investors informed and engaged. The challenge lies in striking the right balance - providing enough detail without overwhelming, while ensuring consistency across all communications.
Setting a Consistent Schedule
For most commercial real estate investments, quarterly reporting is the standard. These updates typically cover financial performance, distributions, and progress on the business plan. A quarterly cadence allows enough time to gather meaningful data while keeping investors in the loop about their investment's direction.
In more volatile markets, many sponsors are shifting to monthly updates. These updates might include market insights, property highlights, or distribution notifications, providing reassurance and reinforcing confidence in the investment's stability.
Your reporting frequency should align with your investment strategy. For instance, development projects often require more frequent updates during active phases, while stable income-generating properties can maintain a quarterly schedule without losing investor trust.
Consistency in timing creates a foundation for delivering tailored, audience-specific content.
Customizing Reports for Different Stakeholders
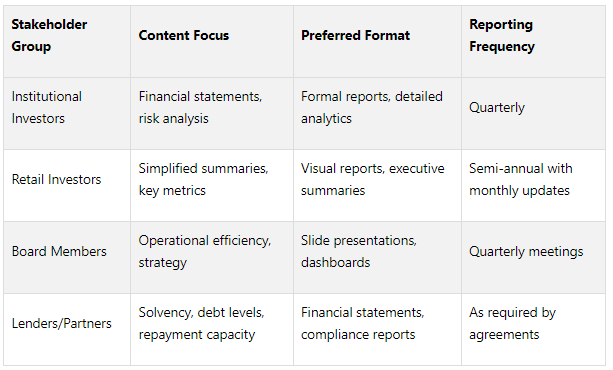
Tailoring reports to meet the needs of different investor groups is essential for effective communication. Institutional investors typically need detailed financial statements, risk assessments, and benchmark analyses to satisfy their internal and regulatory requirements. On the other hand, retail investors benefit from simplified summaries, clear visuals, and minimal technical language.
Adjust the complexity of your reports to match your audience's expertise. For institutional investors, include cash flow breakdowns, market comparisons, and sensitivity analyses. For individual investors, focus on key performance indicators like occupancy rates, rental income growth, and distribution yields, presented in a straightforward manner.
The format of your communication also matters. Institutional investors often prefer formal reports with detailed analytics, while slide decks are ideal for board meetings, where discussions focus on strategy, operational efficiency, and capital allocation. For sophisticated investors, interactive dashboards provide real-time data exploration, offering a deeper dive into the numbers.
With 54% of investors anticipating investment activity to rebound by the first half of 2025, the demand for timely, transparent reporting continues to grow.
Using Charts and Summaries
Once you've established the reporting schedule and tailored the content to your audience, visual tools become essential for simplifying complex data. Charts and summaries help investors quickly grasp key insights.
Line charts: Highlight trends like net operating income growth or occupancy rate changes over time.
Bar charts: Compare returns across properties or against benchmarks.
Pie charts: Break down asset allocation or revenue sources.
Waterfall charts: Show how individual components contribute to overall performance.
Dynamic charts that track metrics like year-over-year ROI or liquidity shifts can reveal patterns that might otherwise go unnoticed. Use consistent color coding - green for positive results, red for concerns, and neutral tones for baseline data - to make the visuals easy to interpret. Always include clear titles, labeled axes, and concise captions to ensure clarity.
Executive summaries at the start of each report are invaluable for busy investors. These summaries should distill the most critical updates into a brief, digestible format, incorporating specific numbers to provide context. For example, instead of saying "NOI compression due to elevated OpEx", use plain language like "Net Operating Income decreased 8% due to higher maintenance costs."
Interactive elements, such as clickable charts in digital reports, can enhance the experience for tech-savvy investors while keeping all essential information accessible to more traditional readers. Clear and straightforward summaries, free of industry jargon, ensure that all stakeholders - regardless of their expertise - can easily understand the performance and trajectory of their investment.
Technology and Professional Services
Investor reporting in commercial real estate (CRE) has come a long way. Gone are the days of relying solely on spreadsheets and quarterly email updates. Today, a blend of advanced technology and professional services is shaping how firms communicate with investors. Technology streamlines data handling, while professional expertise ensures precision and strategic insights. Together, they create a reliable system for clear and timely communication.
Automating Reporting Processes
Automation is changing the game for CRE firms, simplifying reporting workflows by cutting out tedious manual tasks and minimizing human errors. In fact, 72% of real estate owners and investors are already using AI-powered tools.
Modern CRE software connects systems like property management platforms, accounting tools, and third-party data sources to automate tasks such as collecting financial statements, occupancy data, and compliance records. This real-time data integration ensures that all stakeholders stay informed about key updates while reducing the risk of miscommunication. With less time spent on routine tasks, teams can focus on deeper analysis and strategic decision-making.
But the perks don’t stop at saving time. Automated systems centralize data, creating a single source for monitoring trends, tracking vacancies, and managing lease renewals. Built-in validation checks catch errors early, maintaining the trust that is essential for investor relationships.
“Technology has played a huge role in shortening the time it takes to both market and sell a property, and that technology has allowed investors to transact across ever-increasing distances.”
For firms considering automation, a smart starting point is to focus on the most time-consuming tasks, like data collection and report formatting. Once these processes are streamlined, teams can explore more advanced features, such as predictive analytics, as the system demonstrates its value.
Advanced Analytics for Better Reports
Automation is just the beginning. Advanced analytics take things further by turning raw property data into insights that guide smarter investment decisions. Modern platforms now integrate market data to provide a more complete picture.
Predictive analytics represents a major leap forward in CRE reporting. By analyzing historical trends and current market conditions, these tools can forecast shifts in property values, tenant behaviors, and overall market trends. This means investors gain insight not only into past performance but also into what’s likely to happen next.
Interactive dashboards and visualization tools make it easier to explore this data in real time, whether you're reviewing portfolio summaries or diving into detailed property metrics. These mobile-friendly dashboards ensure you can access critical information whenever and wherever you need it.
Cloud-based analytics platforms also scale effortlessly as portfolios grow, processing large volumes of data in real time. Features like AI-powered alerts notify investors of market changes or property value fluctuations that could impact returns. Even better, natural language query tools let users ask questions in plain English and get instant insights - no technical expertise required.
The best analytics platforms go beyond numbers. Narrative-based dashboards help translate complex data into clear, engaging stories. Instead of overwhelming investors with raw figures, these tools explain the significance behind the numbers, making reports both informative and compelling.
Using The Fractional Analyst

The Fractional Analyst bridges the gap between cutting-edge technology and expert insight. This service offers a combination of hands-on professional support and self-service tools through its CoreCast platform, catering to firms with varying needs.
The Fractional Analyst team provides comprehensive support for investor reporting, including underwriting, asset management, market research, and customized financial analysis. Their goal is to deliver reports that meet industry standards while offering strategic insights.
“Investors want clarity not just on the numbers, but also on the story behind those numbers. They seek assurance that their investments are performing well compared to market benchmarks and that you’re actively managing risks.”
For firms that prefer to manage their own reporting, the CoreCast platform offers professional-grade tools for $50 per user per month during beta testing, increasing to $105 after full deployment. It automates data collection, analysis, and report generation, giving firms the infrastructure they need to streamline their processes.
To further support firms at the start of their technology journey, The Fractional Analyst provides free financial models, including templates for multifamily acquisitions, mixed-use developments, and IRR matrices. These resources offer immediate utility while showcasing the benefits of more advanced solutions.
Conclusion
Building strong investor relationships in commercial real estate (CRE) boils down to two critical factors: transparency and consistent communication. With 63% of investors emphasizing the importance of transparency, it's clear that adopting best practices in reporting directly influences your ability to attract and retain capital. By focusing on balanced reporting, variance analysis, and meeting regulatory standards, firms lay the groundwork for leveraging technology and tailoring reports to meet investor needs.
Customization and consistency are essential to fostering trust. Crafting reports that cater to specific investor groups while maintaining a regular reporting cadence ensures stakeholders receive information that’s both relevant and accessible. The challenge - and opportunity - lies in finding the right balance between efficient, standardized reporting and personalized communication.
Technology is reshaping how firms engage with investors. Companies that embrace modern tools are seeing tangible results, from increased portal logins to higher email click-through rates. Advanced tech solutions are also driving operational improvements across the industry, turning time-consuming processes into streamlined workflows with measurable outcomes.
Northland Investment Corporation revolutionized its investor package preparation. What once required eight team members over four days is now handled by a single person in just one day. These examples highlight how technology not only saves time but also enhances accuracy and reliability.
Another way to bolster transparency is by providing detailed distribution information. This not only helps investors make more informed decisions but also underscores your dedication to accountability.
While the CRE landscape continues to evolve, one thing remains constant: investors value clarity, consistency, and trust. Firms that prioritize open communication, tailored reporting, and advanced analytics are well-positioned to achieve lasting success with their investors.
FAQs
-
Technology has transformed how investor reporting is handled in commercial real estate, making the process faster and more precise. By automating tasks like data collection, analysis, and reporting, it minimizes manual errors, saves valuable time, and ensures consistent results.
With the help of AI and data analytics, advanced tools now offer real-time insights, predictive modeling, and uniform data formats. These capabilities not only improve the accuracy of valuations and forecasts but also simplify workflows. The result? Greater transparency and stronger trust with investors, which can lead to higher retention rates and more informed decision-making.
-
To thoroughly assess financial performance, a CRE investor report should feature key metrics like Net Operating Income (NOI), Capitalization Rate (Cap Rate), Internal Rate of Return (IRR), Cash Flow, Cash-on-Cash Return, and Return on Investment (ROI). These figures collectively offer a detailed view of profitability, returns, and the overall performance of the investment.
By including these essential metrics, reports not only make financial data more transparent but also strengthen trust with investors. Clear and consistent reporting provides actionable insights, helping investors make well-informed decisions and fostering long-term confidence.
-
Customizing investor reports for different stakeholders is all about delivering the right information to the right people in a way that resonates with their specific interests and priorities. When data is presented clearly and tailored to their needs, it helps promote clarity, build trust, and show that you truly understand what matters to them.
This personalized effort doesn’t just make communication smoother - it also makes investors feel appreciated. And when investors feel valued, it strengthens relationships and boosts satisfaction. Over time, this can lead to higher retention rates and a more engaged group of investors.