Exit Cap Rates vs. Discount Rates in DCF
When valuing commercial real estate using a Discounted Cash Flow (DCF) model, exit cap rates and discount rates are two critical metrics. Here’s a quick summary:
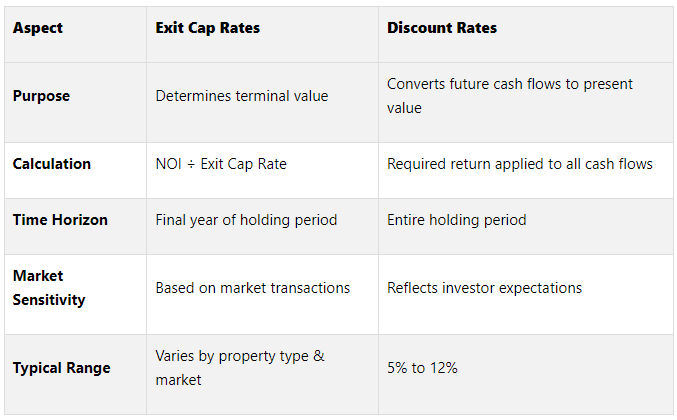
Exit Cap Rates: Used to estimate a property’s terminal value by dividing the projected Net Operating Income (NOI) in the final year of the holding period by the exit cap rate.
Example: If NOI is $625,000 and the exit cap rate is 5.5%, the terminal value is $11.4 million.Discount Rates: Used to calculate the present value of future cash flows. It reflects the return an investor needs to justify the investment, typically ranging from 5% to 12%.
Key Differences:
Exit Cap Rates focus on terminal value (end of the holding period), while Discount Rates apply to all cash flows over the holding period.
Exit Cap Rates are market-driven, while Discount Rates are subjective and investor-specific.
Quick Comparison:
Why It Matters:
Terminal Value Sensitivity: Terminal value often accounts for 60%–80% of a DCF valuation. Small changes in these rates can significantly impact property values.
Market Conditions: Interest rates, inflation, and economic uncertainty affect both rates, but in different ways. For example, rising interest rates increase discount rates faster than cap rates.
Understanding these metrics ensures accurate property valuations and better investment decisions. Let’s dive deeper into how they work and what factors influence them.
Discounted Cash Flow Analysis (DCF) in Real Estate Explained
Exit Cap Rates in DCF
Exit cap rates are a cornerstone in determining a property's terminal value, which often accounts for 60% to 80% of the total value in a Discounted Cash Flow (DCF) analysis. Getting these rates right is critical for sound investment decisions.
How to Calculate Exit Cap Rates
The exit cap rate formula is straightforward: the terminal value equals the projected Net Operating Income (NOI) at the time of sale divided by the exit cap rate. Here's an example to break it down:
Imagine a commercial real estate firm analyzing a $10 million office building. The property generates $500,000 in NOI, giving it an entry cap rate of 5.0%. With NOI expected to grow to $625,000, and an exit cap rate of 5.5%, the terminal value calculation would look like this:
$625,000 ÷ 5.5% = $11.4 million.
Arriving at this calculation involves three main steps:
Conduct a market analysis to gather data that influences the property’s value at the time of sale.
Forecast the NOI by studying comparable properties and market demand.
Establish the exit cap rate using current market cap rates and external economic factors.
A common industry practice is to add 10 basis points (0.1%) to the cap rate for each year of the holding period. This adjustment accounts for uncertainties over time.
What Affects Exit Cap Rates
Several variables shape exit cap rates, making precise projections a challenge.
Market conditions are a primary driver. Changes in interest rates, economic cycles, and capital market trends directly influence what buyers are willing to pay at the time of sale. Investors often rely on economic forecasts to adjust their assumptions for the expected sale year.
Property-specific factors also play a role. Characteristics like location, building condition, lease agreements, and the creditworthiness of tenants affect the cap rate. For example, properties in struggling markets or with aging infrastructure typically demand higher cap rates, which lowers their terminal value.
Trends in asset classes further impact exit cap rates, as different property types respond to market shifts in unique ways. Here's a look at recent forecasts:
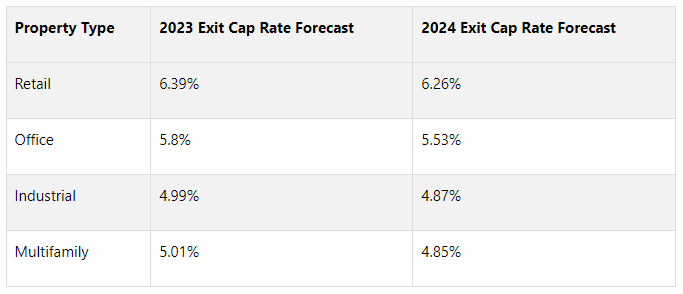
Exit cap rates are often higher than entry cap rates to account for aging properties and market uncertainties.
How Exit Cap Rates Change Terminal Value
The link between exit cap rates and terminal value is both direct and impactful. Even small shifts in the exit cap rate can lead to significant changes in property valuation and investment returns.
“Understanding and using the correct exit cap rate is essential for accurately forecasting investment returns. A small change in your exit cap rate assumption can significantly affect your projected returns, including IRR (Internal Rate of Return) and equity multiples.”
For instance, a 50 basis point change in the exit cap rate can alter a property’s value by 12.1%. On a $10 million property, this translates to over $1.2 million in valuation difference. A lower exit cap rate compared to the entry cap rate can generate capital gains if NOI remains stable. On the flip side, higher exit cap rates reduce terminal value and, subsequently, overall returns.
This sensitivity highlights the importance of conservative underwriting. Overly optimistic assumptions can lead to mispricing and distorted projections. Since terminal value typically makes up about three-quarters of the total DCF valuation, accuracy in estimating the exit cap rate is pivotal for investment success.
With exit cap rates covered, the next step is to delve into the role of discount rates in DCF models.
Discount Rates in DCF
While exit cap rates help determine the sale price of an asset, discount rates play a different but equally important role in the discounted cash flow (DCF) model. They translate future cash flows into present value, bridging the gap between tomorrow's earnings and today's investment decisions. Essentially, discount rates are the tool that lets you compare the value of future dollars to their worth right now.
What Discount Rates Do
The discount rate is the interest rate used to calculate the present value of future cash flows in a DCF analysis. Think of it as the minimum return an investor needs to justify putting money into a project today rather than pursuing other options. This concept embodies a core financial principle: a dollar today is worth more than a dollar in the future [18, 19]. By applying the discount rate, you can determine how much you'd need to invest now to achieve a specific future cash flow.
But there’s more to it. The discount rate also reflects the risk tied to the investment. Riskier projects require higher discount rates to compensate for the uncertainty. For example, a fully leased, stable office building in Manhattan might have a lower discount rate compared to a speculative development in a less established area.
What Makes Up the Discount Rate
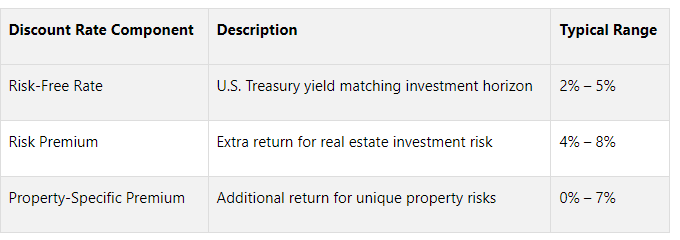
Several elements combine to form the discount rate, capturing both the time value of money and the risks involved in the investment:
Risk-free rate: This is the baseline, often based on the yield of U.S. Treasury bonds with a matching maturity. It represents the return you could earn with virtually no risk.
Risk premium: This accounts for the extra return needed to offset the uncertainties of commercial real estate investments. These risks might include market downturns, tenant defaults, or property-specific challenges.
Opportunity cost: This reflects the returns you could earn by investing in comparable alternatives with similar levels of risk [18, 21]. For instance, if office buildings in your market are yielding 8%, your discount rate should align with that benchmark.
The choice of discount rate varies by investor. Some might use their weighted average cost of capital, others may rely on historical returns from similar projects, or base it on opportunity costs. Discount rates for commercial real estate typically range between 12% and 20%.
This breakdown highlights how discount rates, much like exit cap rates, directly influence terminal value in a DCF model.
How Discount Rates Affect Terminal Value
The components of the discount rate are critical in determining the present value of future cash flows, making their estimation a key factor in terminal value projections. There’s a direct relationship here: a higher discount rate lowers the present value of future cash flows, meaning future earnings are worth less today. Even small adjustments in the discount rate can significantly impact property valuations.
Here’s a clear example of how discount rate changes affect a property's Net Present Value (NPV):
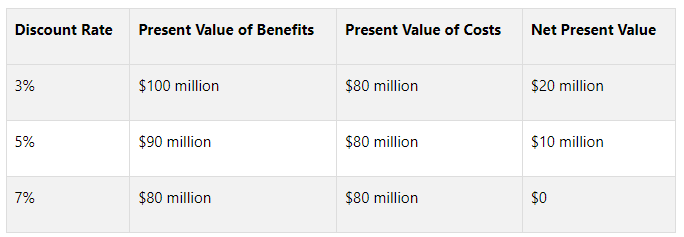
This sensitivity is particularly important because terminal value often accounts for about 75% of the total valuation in a DCF model. A lower discount rate tends to favor projects with steady, long-term growth in cash flows, while a higher rate benefits projects with quicker, front-loaded returns.
To account for this sensitivity, it's wise to conduct a sensitivity analysis. By running the DCF model with varying discount rate assumptions, investors can explore a range of potential outcomes. This approach provides a clearer picture of risks and rewards, helping investors make more informed decisions based on their risk tolerance and market expectations. The interaction between discount rates and terminal value is a key factor in achieving accurate valuations through the DCF method.
Transform Your Real Estate Strategy
Access expert financial analysis, custom models, and tailored insights to drive your commercial real estate success. Simplify decision-making with our flexible, scalable solutions.
How Market Conditions Affect Both Rates
Continuing from our earlier discussion on how each rate operates, let's delve into how market conditions influence both metrics. Economic shifts and financial trends impact exit cap rates and discount rates differently, which in turn affects property valuations.
How Each Rate Responds to Market Changes
Interest rate changes play a significant role in shaping both rates, though the mechanisms differ. When the Federal Reserve raises rates, discount rates typically adjust quickly since they're tied to the risk-free rate plus a risk premium. For instance, between Q2 2022 and Q3 2024, discount rates climbed by 104 basis points, moving from 4.84% to 5.88%. Exit cap rates, on the other hand, tend to follow with a slight delay. During that same period, going-in cap rates rose by 139 basis points, increasing from 5.98% in Q1 2022 to 7.37% in Q3 2024. As JPMorgan Chase explains:
“While they aren’t considered a primary driver of cap rates, interest rate changes can influence cap rates as the cost of borrowing will impact return on investments.”
These shifts highlight how broader economic changes shape these market metrics.
Economic uncertainty also affects both rates, though in distinct ways. During times of financial stress, cap rates often rise as investors seek higher returns to compensate for increased risk.
Inflation pressures introduce another layer of complexity. Rising inflation can narrow cap rate spreads, while discount rates may increase to ensure real returns remain above inflation. This dynamic can reduce the gap between the two rates, directly impacting terminal value calculations.
Recent data underscores how property sectors respond differently to these changes. Between Q2 2023 and Q3 2024, cap rates in multifamily, industrial, and office sectors rose by 0.4% or more. This increase was slower compared to the 0.8% or greater rise seen between Q2 2022 and Q3 2023, indicating a moderation in the rate of change.
Investor sentiment, limited capital availability, and reduced transaction volumes add to the complexity. Transaction volumes dropped 30% year-over-year and are 34% lower compared to the trailing 10-year average. Green Street Advisors reported that cap rates across core sectors widened by 190 basis points, with office properties leading at 255 basis points and multifamily at 195 basis points. These shifts reflect not only interest rate changes but also waning investor interest in certain property types, increasing the uncertainty of exit cap rate projections.
As these adjustments ripple through the market, their influence on property values becomes increasingly clear.
How Rate Changes Affect Property Values
Rate adjustments have a notable impact on property valuations. A 0.50% change in both the discount rate and exit cap rate can lead to a 12.1% shift in property value. This level of sensitivity is especially important given that terminal value often represents a large share of the overall valuation in many DCF models.
Real-world examples illustrate these effects. From April 2020 to April 2022, Blackstone REIT's industrial assets experienced declining discount rates and exit cap rates, resulting in a potential value increase of over 13% for those assets. This contributed to a 43% rise in the REIT's net asset value (NAV) per share during that period. Similarly, Starwood REIT saw its NAV per share grow from $21.22 to $27.34 - a 29% increase - between April 2020 and April 2022. Changes in discount and exit cap rates accounted for over half of this appreciation, particularly in its multifamily assets, which made up 65% of its portfolio.
The directional impact of rate changes depends on which rate shifts more significantly. If discount rates rise faster than exit cap rates, the present value of interim cash flows becomes more sensitive. Conversely, a more rapid increase in exit cap rates has a greater effect on terminal value.
Current market trends highlight this dynamic. Green Street Advisors' Commercial Property Pricing Index dropped from a peak of 154 in 2022 to around 119, marking a 23% decline in average private property values across major commercial real estate sectors. Similarly, the NCREIF Property Index fell approximately 15%, from a peak of 170 in Q4 2022 to 144.
Looking ahead, expected Federal Reserve rate cuts in 2025 could lower borrowing costs and reduce cap rates. However, the timing and scale of these changes will determine whether discount rates and exit cap rates move in sync or diverge, ultimately shaping property valuations.
This sensitivity to rate changes underscores the importance of conducting thorough sensitivity analyses on both rates. Such analysis helps investors understand the range of potential property values and make well-informed decisions.
Exit Cap Rates vs Discount Rates: Side-by-Side
Now that we've covered how market conditions influence both exit cap rates and discount rates, let's dive into their key differences and how they apply to Discounted Cash Flow (DCF) modeling. Understanding these distinctions is crucial for commercial real estate professionals aiming to make informed decisions during underwriting.
Main Differences in How They Work
The primary differences between exit cap rates and discount rates lie in their calculation, sensitivity to market conditions, and specific roles in DCF analysis. Exit cap rates focus on a property's value based on a single year's Net Operating Income (NOI), effectively tying one year's NOI to the property's value. On the other hand, discount rates represent the return investors expect, used to bring future cash flows back to their present value over the entire holding period.

Exit cap rates are generally influenced by observable market transactions and comparable sales data. In contrast, discount rates are more subjective, reflecting the returns required by individual investors. Another key distinction lies in how growth is handled: while cap rates implicitly account for growth, DCF analysis explicitly incorporates it through projected cash flows .
These differences highlight how each rate serves distinct purposes, making it essential to select the right one based on specific market and investment goals.
How to Choose the Right Rates
Choosing the appropriate rates involves balancing market data with investor-specific risk and return criteria. As mentioned earlier, exit cap rates are derived from actual market transactions, while discount rates reflect the returns investors require. Discount rates, though somewhat subjective, should align with market data, investor expectations, and logical benchmarks. In most commercial real estate transactions, investors target discount rates in the range of 7.5%–9.5%, with an overall range of 5%–12% .
When selecting a discount rate, investors should consider their desired returns, the property's risk profile, and market trends. Since the discount rate reflects the perceived risk of an investment, it’s essential to align it with both the investor's strategy and the market’s direction .
For exit cap rates, market data provides a clearer guide. A common practice is to set the exit cap rate slightly higher than the entry cap rate, reflecting the assumption of increased risk or depreciation over time. Conservative estimates are typically recommended to account for market fluctuations .
To make well-supported decisions, professionals should rely on detailed market and property data rather than broad surveys. Historical equity yields, which often range from 1.50x to 2.00x the market-based mortgage interest rate, can also serve as benchmarks for discount rate selection.
By combining cap rate analysis with detailed DCF modeling, professionals can quickly compare market opportunities while conducting thorough investment assessments. This dual approach ensures a balanced perspective, integrating high-level market insights with deep financial analysis.
When presenting these rates to investors or lenders, thorough documentation is crucial. Each rate should be backed by market comparisons, investor return requirements, and a clear risk analysis. This is especially important if the rates fall outside typical ranges or when market conditions create uncertainty around assumptions.
The Fractional Analyst's underwriting services can help professionals align exit cap and discount rates with both market realities and investor goals, ensuring a well-rounded approach to real estate analysis.
Conclusion
Exit cap rates and discount rates are two central components in determining property values within DCF models. While they both play a critical role in valuation, they serve distinct purposes and react differently to shifts in the market.
Key Points to Keep in Mind
Exit cap rates determine the terminal value based on the final year's NOI, while discount rates translate future cash flows into present value. Both have an inverse relationship with property values, but their influences differ significantly.
Market conditions affect these rates in unique ways. Exit cap rates are largely shaped by observable transactions and comparable sales, making them more grounded in market data. Discount rates, on the other hand, are more subjective, reflecting individual investor preferences, risk tolerance, and return expectations. Typically, discount rates for commercial real estate range between 5% and 12%.
Timing also sets these rates apart. Exit cap rates focus on the last year of the holding period, requiring consideration of future market conditions and property aging. This is why exit cap rates are often set higher than entry cap rates, accounting for increased uncertainty or potential market shifts. Meanwhile, discount rates span the entire investment period, capturing the broader timeline of cash flows.
These distinctions underscore the importance of carefully tailoring underwriting approaches to changing market dynamics.
The Importance of Market Sensitivity in Valuations
In today’s unpredictable economic climate, market sensitivity analysis is essential. Recent data highlights this volatility: national cap rates rose in 2024, though at a slower pace than the previous year. Multifamily, industrial, and office cap rates each climbed by 0.4% or more between Q2 2023 and Q3 2024. This fluctuation shows how static assumptions can lead to valuation missteps.
Entry cap rates reflect current market conditions, while exit cap rates project future scenarios. Because of this forward-looking nature, sensitivity analysis becomes a vital tool. By modeling different scenarios with varying rate assumptions, investors can better anticipate potential outcomes and adjust strategies accordingly.
This practice isn’t limited to initial underwriting. Investors should regularly revisit discount rates and cap rates to align with evolving market trends, industry changes, and shifts in risk environments. Routine reassessment helps keep investment strategies relevant and informed.
Additionally, property-specific factors play a role in rate sensitivity. Different asset classes come with varying risk levels, and cap rates are just one metric among many used to evaluate commercial real estate. Both macroeconomic trends and individual property characteristics must be factored in when selecting a cap rate.
Combining detailed market analysis with sensitivity testing provides a strong foundation for informed decision-making. When presenting valuations to stakeholders, showing how rate variations impact property values demonstrates thorough due diligence. This approach is especially crucial during periods of market transition, where traditional benchmarks may fall short in capturing emerging risks or opportunities.
FAQs
-
Interest rate shifts play a key role in shaping exit cap rates and discount rates in a Discounted Cash Flow (DCF) analysis. When interest rates go up, these rates usually follow suit. This reflects the increased cost of borrowing and the higher returns investors expect, which often translates to lower property values.
Conversely, when interest rates drop, exit cap rates and discount rates tend to fall as well. This can boost property valuations. The reason? Both rates are closely tied to overall economic trends and investor risk appetite, which are heavily influenced by changes in interest rates.
-
Understanding how exit cap rates and discount rates affect property valuation is crucial for real estate investors. These metrics are highly responsive to market fluctuations, and even slight changes can dramatically alter a property's terminal value and overall returns.
By performing sensitivity analysis on these rates, investors gain a clearer picture of potential risks and rewards across various market conditions. This deeper insight supports smarter decision-making, enabling investors to navigate uncertainties and adjust their strategies effectively in a dynamic real estate market.
-
When choosing a discount rate for a Discounted Cash Flow (DCF) model, you need to factor in the risk profile of the investment. Two common methods for determining this rate are the Weighted Average Cost of Capital (WACC) and the Capital Asset Pricing Model (CAPM). These approaches take into account both the cost of equity and debt, as well as the market risk premium.
It’s also essential to match the discount rate to the unique characteristics of the asset. This includes considering its risk level, the predictability of its cash flows, and prevailing market conditions. Making the right choice often involves using professional judgment and staying informed about current economic trends to ensure the rate properly reflects the balance between risk and expected returns.