
Steps to Build Scenario Models for CRE Trends

A CRE scenario model answers one simple question: does the deal still work if the market changes? I’d build it by setting one decision, picking the few inputs that can move returns, linking those inputs to a base model, and then testing base, upside, downside, and stress cases.
In plain terms, this process helps me test what happens if rent growth drops to 2%, vacancy climbs by 3 points, or the exit cap rate moves out by 50 bps. From there, I can see how those changes hit NOI, DSCR, IRR, and equity multiple before I make a buy, hold, refinance, or sell call.
Here’s the short version:
- Start with one question: for example, will DSCR stay above 1.25x during a refinance window?
- Set the scope: one market, one property type, and usually a 5- to 10-year forecast.
- Pick the drivers that matter most: rent growth, vacancy, expenses, debt terms, rates, and exit cap rate.
- Group assumptions into cases: Upside, Base, Downside, and Severe Stress.
- Link each case to the model: use one scenario selector so all linked assumptions switch at once.
- Check the outputs: if vacancy goes up, NOI and DSCR should move down. If exit cap rates go up, value should move down.
- Use the results to act: lower leverage, change timing, or revise underwriting if the downside case gets weak.
One point matters here: scenario modeling is not the same as sensitivity analysis. Sensitivity testing changes one input at a time. Scenario modeling changes several connected inputs at once, which is often closer to how CRE markets move in practice.
If I need a fast way to frame CRE trend risk, this is the structure I’d use.
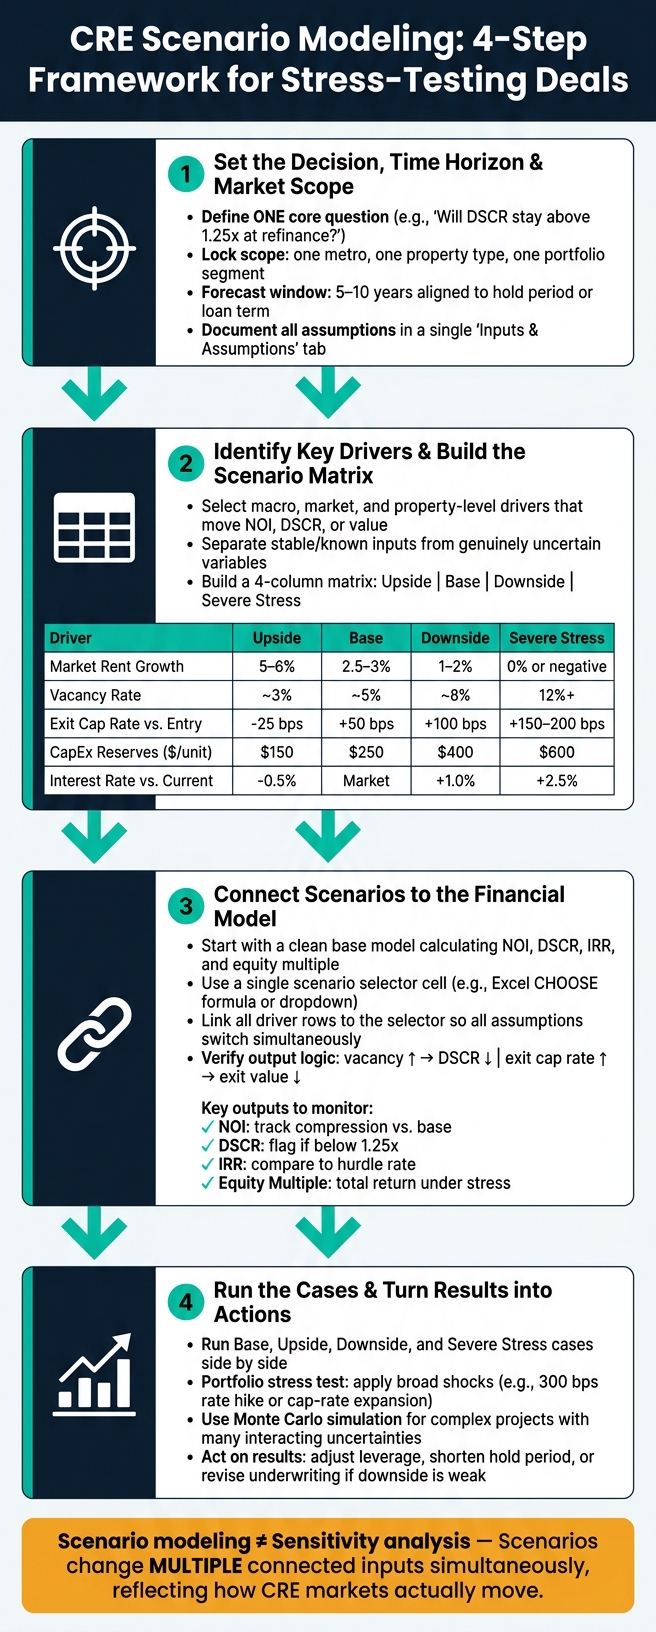
CRE Scenario Modeling: 4-Step Framework for Stress-Testing Deals
Real Estate Modeling - Scenario Analysis
sbb-itb-df8a938
Step 1: Set the Decision, Time Horizon, and Market Scope
With the scenario structure in place, tighten your multifamily model around one decision, one market, and one forecast window. Before you build even a single formula, write one plain sentence that states what the model needs to answer. If that sentence is fuzzy, the model drifts fast.
Define the Core Question and Model Objective
Start with one question the model must answer. For example, can the asset still maintain DSCR and returns if rent growth slows or vacancy goes up?
That framing shows you which outputs matter most. It also keeps the model centered on the variables tied to the decision: NOI, DSCR, IRR, and equity multiple.
Choose Geography, Property Type, and Forecast Period
Once the decision is set, lock the scope down: one metro or submarket, one property type, and one portfolio segment. If you make the market scope too broad, the model gets harder to use and harder to trust.
The forecast period should line up with the actual plan. A 5- to 10-year horizon will often fit the hold period, lease-up window, or loan term. If the model is being used for a refinancing call, extend the forecast through the refinance window so you can stress-test DSCR at that point.
Document Assumptions in a Clean Input Sheet
Put all scenario inputs on one tab labeled Inputs & Assumptions. That makes updates faster and reviews a lot less messy.
Next, identify the drivers that will change across scenarios.
Step 2: Identify the Key Drivers and Build the Scenario Matrix
Now trim your input list down to the drivers that can materially change returns.
Select Macro, Market, and Property-Level Drivers
Focus on the inputs that move NOI, DSCR, or value in a meaningful way: rates, inflation, employment, supply, absorption, rent growth, vacancy, concessions, occupancy, expenses, debt terms, and exit cap rate.
Keep the list tight. Small admin costs that tend to move with overall operating costs can usually sit inside one expense ratio instead of being modeled one by one. The point is to build a matrix where every row matters for a decision.
Separate Known Trends from Uncertain Variables
Before building the matrix, sort each driver into one of two buckets: stable/known or genuinely uncertain.
Stable inputs can remain in the baseline model. Fixed-rate debt coupons are a good example. In most cases, you don't need separate scenario rows for them unless there's a real chance of default or renegotiation.
Uncertain drivers are where scenario work earns its keep: refinancing spreads, future leasing spreads to market, renewal probabilities, and occupancy under different demand conditions. Model those items as ranges, not single-point estimates, because they're the ones that shape the downside and stress cases.
That split matters. If you load the matrix with low-uncertainty items, it gets cluttered fast, and the big risks get buried. Save scenario rows for variables that would actually change how you structure the deal, size the debt, or plan the capital program.
Build a Driver-by-Scenario Assumption Matrix
Once you've picked and sorted the drivers, place them into a matrix with four columns: Upside, Base, Downside, and Severe Stress. Group the rows by category. Each cell should show the assumption for that driver under that case, using the right unit:
- Percentages for rent growth or vacancy
- Basis points for rate spreads or cap rate changes
- Dollar amounts for capex reserves
If your model uses occupancy instead of vacancy, convert the same assumptions into the matching occupancy target before linking the formulas.
These ranges show the kind of assumptions analysts use across scenario cases. They aren't point forecasts. They're brackets that line up with plausible market conditions.
| Driver Category | Driver | Upside | Base | Downside | Severe Stress |
|---|---|---|---|---|---|
| Macro | Interest Rate (vs. Current) | Current - 0.5% | Current Market | Current + 1.0% | Current + 2.5% |
| Macro | Inflation (CPI) | ~2.0% | ~2.8% | ~4.0% | ~6.0% |
| Market | Market Rent Growth | 5%–6% | 2.5%–3.0% | 1.0%–2.0% | 0% or negative |
| Market | Concessions (Free Rent / TI) | Minimal | Typical | Elevated | Very high |
| Market | Vacancy Rate (Stabilized Occupancy) | ~3% (97%) | ~5% (95%) | ~8% (92%) | ~12%+ (88% or lower) |
| Property | OpEx Growth | 1%–2% | ~3% | ~5% | 7%+ |
| Property | CapEx Reserves | ~$150 | ~$250 | ~$400 | ~$600 |
| Property | Debt Terms (LTV / Spread / Amortization / IO) | Favorable, higher LTV | Typical market | Conservative, lower LTV | Very conservative |
| Property | Exit Cap Rate vs. Entry | -25 bps | Entry + 50 bps | Entry + 100 bps | Entry + 150–200 bps |
Each row should feed the scenario selector in Step 3.
Step 3: Connect Scenarios to the CRE Financial Model
Now it’s time to put the Step 2 matrix to work. Once you’ve mapped each driver to each scenario, the next move is simple: connect those assumptions to a financial model that calculates returns. This is the point where scenario planning stops being theoretical and starts giving you numbers you can use.
Start with a Baseline Model That Already Calculates Returns
Before you build in scenario logic, make sure your base model is clean and working. It should already calculate NOI, DSCR, IRR, and equity multiple without errors. If that setup is solid, layering in scenarios is much easier.
The Fractional Analyst offers free CRE financial models, including a multifamily acquisition model and an IRR matrix, that can give you a head start.
Link Assumptions to Formulas with a Scenario Selector
Use one input cell as your scenario selector. In Excel, that might be a dropdown or a formula-based cell. Then use CHOOSE to pull the right assumption from the driver-by-scenario matrix you built in Step 2.
Each driver row should connect back to that selector. When you switch the scenario, the connected inputs should update across the model. That way, you’re not manually changing rent growth, vacancy, expenses, and exit cap rate one by one every time you test a case.
Tie Outputs to NOI, DSCR, Value, and Investor Returns
From there, check that the outputs move when the scenario changes. If expenses go up, NOI should fall. If vacancy rises, DSCR should weaken. If exit cap rates move up, exit value should drop. The model should react in a way that matches common sense.
Here are the main outputs to watch:
| Output Metric | What It Measures | Downside Threshold to Watch |
|---|---|---|
| Net Operating Income (NOI) | Revenue minus operating expenses | Track compression versus base case. |
| Debt Service Coverage Ratio (DSCR) | NOI ÷ annual debt service | Below 1.25x often signals covenant risk. |
| Exit Value | Estimated sale price at exit | Drops significantly when exit cap rates rise. |
| IRR | Annualized return on equity | Below the target hurdle rate. |
| Equity Multiple | Total cash distributions ÷ equity invested | Use to test total return under stress. |
After each scenario switch, run a formula check. Make sure NOI, DSCR, exit value, IRR, and equity multiple all move in the direction you’d expect. If DSCR stays flat while vacancy changes, that’s a red flag. It usually means a formula link is broken.
Once those links are working, move on to the deterministic cases in Step 4.
Step 4: Run the Cases and Use the Results
Once your scenario logic is wired up and the outputs check out, the next step is simple: run the cases and see what the numbers are saying.
Run Deterministic Cases and Portfolio Stress Tests
Start with your standard base, upside, and downside cases. Each one should give you a clean output set - NOI, DSCR, exit value, IRR, and equity multiple - so you can compare them side by side.
That comparison tells you how the deal reacts if the market gets softer or stronger. And the spread between the base case and the downside case gives you a plain read on risk.
After that, push beyond the single deal.
At the portfolio level, run a broad shock across all assets, like a 300 bps rate hike or cap-rate expansion. This shows you where the weak spots are. Some assets may hold up fine. Others may crack fast. That’s how you find where risk is piling up across the portfolio.
If fixed cases still leave too much gray area, move to simulation.
When to Use Monte Carlo Analysis
Deterministic scenarios are easy to explain. You set a few cases, run them, and compare the outputs.
Monte Carlo analysis works differently. Instead of using only three fixed cases, you assign probability distributions to uncertain inputs and run many iterations. The result is a probability-weighted IRR or value range, not just a base, downside, and upside point.
It’s most useful when a project has a lot of moving parts that affect each other. The tradeoff is that it takes more work and can be harder to explain to other people. Use it when fixed cases don’t give enough detail on uncertainty.
| Method | Best Use Case | Effort Level | Transparency |
|---|---|---|---|
| Scenario Analysis | Testing specific market states (e.g., base, downside, upside) | Medium | High |
| Stress Testing | Portfolio-wide shock analysis (e.g., a 300 bps rate hike) | Medium | High |
| Monte Carlo Simulation | Complex projects with many interacting uncertainties | High | Low |
Conclusion: Turn Scenario Outputs into Actions
Scenario outputs only matter if they change what you do next.
Use the range of results to decide whether the deal still works in the current market. If downside results look weak, change the plan. That might mean lowering leverage, shortening the hold period, or reworking the business plan. Put plainly: let the numbers change leverage, timing, or underwriting before the next decision.
Teams that want to put this into day-to-day practice can work with The Fractional Analyst, where the direct service team handles underwriting, asset management support, and reporting, and CoreCast supports ongoing self-service analysis.
FAQs
How is scenario modeling different from sensitivity analysis?
Sensitivity analysis shows what happens when you change one input - or maybe two - while keeping everything else the same. It’s a simple way to spot which assumptions have the biggest effect on results. Put plainly, it helps you find the main value drivers one by one.
Scenario modeling takes that idea a step further. Instead of changing inputs in isolation, it groups several assumption changes into realistic what-if market setups, like base, best, and worst cases. That gives you a better sense of how a portfolio might perform when different variables shift at the same time.
Which assumptions matter most in a CRE scenario model?
The most important assumptions are the ones that drive cash flow and exit value:
- Rental income and rent growth
- Vacancy and occupancy
- Operating expense growth and inflation
- Capital expenditures
- Financing and interest rates
- Exit cap rate
These are also the main inputs to stress-test and use for sensitivity analysis.
When should I use Monte Carlo instead of fixed scenarios?
Use Monte Carlo instead of fixed scenarios when you’re dealing with lots of uncertain inputs that can affect each other. It’s the better choice when you need a probability-based range of outcomes, not just a small set of preset cases.
This approach works well for large, complex projects because it runs thousands of iterations with randomly changing inputs. That gives you a deeper, more realistic view of risk than changing one variable at a time.