
Cash-on-Cash Return Formula Explained
Cash-on-cash return is a simple way to measure how much cash a real estate investment generates annually compared to the cash you’ve invested. It’s calculated using this formula:
Cash-on-Cash Return (%) = Annual Pre-Tax Cash Flow ÷ Total Cash Invested
Here’s what you need to know:
Annual Pre-Tax Cash Flow: The cash left after paying operating expenses and debt, excluding taxes.
Total Cash Invested: Your total upfront cash, including down payment, closing costs, and initial improvements.
For example, if your property generates $25,000 in annual pre-tax cash flow and you’ve invested $200,000, the cash-on-cash return is 12.5%.
This metric is especially useful for investors focusing on cash flow rather than long-term appreciation. A return between 8% and 12% is generally considered strong, though this varies by market and property type.
While cash-on-cash return is easy to calculate and useful for quick comparisons, it doesn’t account for property appreciation, tax benefits, or long-term value changes. Pair it with other metrics like IRR for a more complete investment analysis.
Cash-on-Cash Returns Explained [Full Breakdown]
Parts of the Cash-on-Cash Return Formula
The cash-on-cash return formula is built on two key components that reveal how well your cash investment is working for you. Breaking these parts down helps ensure accurate calculations and smarter investment decisions.
Annual Pre-Tax Cash Flow
The annual pre-tax cash flow represents the cash your property generates after paying for operating expenses and debt obligations, but before taxes. It’s essentially the cash you’re pocketing each year from the investment.
To calculate this, start with the property’s gross rental income and subtract operating expenses, such as property management fees, insurance, maintenance, utilities, and property taxes. After that, deduct your annual debt service payments, which include both the principal and interest on any loans tied to the property.
Here’s an example: Suppose your property earns $120,000 per year in rental income, incurs $30,000 in operating expenses, and requires $60,000 in annual debt payments. Your annual pre-tax cash flow would be $30,000 ($120,000 - $30,000 - $60,000).
This metric stands out because it accounts for the impact of financing. Unlike other calculations that ignore debt, cash-on-cash return reflects how leverage changes your cash flow. Properties with higher debt levels will show different cash flow patterns compared to those purchased with more equity.
The "pre-tax" aspect is important because it excludes tax considerations like depreciation, which vary by individual tax situations and don’t involve actual cash transactions.
Once you’ve calculated your pre-tax cash flow, the next step is determining your total cash invested.
Total Cash Invested
Total cash invested includes all the upfront cash you spend to acquire and prepare the property. This generally covers your down payment, closing costs, and any immediate renovations or improvements required to make the property income-producing.
Closing costs often include loan origination fees, attorney fees, title insurance, property inspections, and appraisal charges.
For example, if an investor buys a $1,000,000 property, puts down $100,000, pays $10,000 in closing costs, and spends $25,000 on improvements, the total cash invested would be $135,000 ($100,000 + $10,000 + $25,000).
Getting this number right is crucial. If you underestimate your total cash invested, your cash-on-cash return will look better than it actually is, leading to flawed comparisons between investments. Some investors make the mistake of including only the down payment, but this doesn’t capture the full cash commitment required.
This figure represents your equity - the portion of the property’s cost that comes from your own funds rather than borrowed money. This distinction is particularly important when comparing opportunities with different financing structures.
While future capital expenditures aren’t typically included in the initial total cash invested, some investors track these ongoing contributions separately to monitor how their returns evolve over time.
How to Calculate Cash-on-Cash Return
Calculating cash-on-cash return is straightforward when you follow the right formula and steps.
The Formula and Steps
The formula for cash-on-cash return is:
Cash-on-Cash Return (%) = Annual Pre-Tax Cash Flow ÷ Total Cash Invested
This calculation shows how much of your invested cash is being returned as pre-tax income each year, expressed as a percentage.
To ensure accurate results, start with the annual pre-tax cash flow and divide it by the total cash invested. Be meticulous with your numbers - hidden costs, partial rental periods, or mixing net and gross income can distort your results. For example, mislabeling financing fees or using inconsistent data sources could make your investment appear more or less profitable than it actually is. Attention to detail is key.
Example Calculation
Let’s see how this formula works with two practical examples.
Example 1: Commercial Rental Property
A real estate investor purchases a rental property with a potential gross income of $100,000. After accounting for $25,000 in vacancy and credit losses, the effective gross income drops to $75,000. Operating expenses total $30,000, leaving a net operating income of $45,000. After deducting $20,000 in annual mortgage payments, the annual pre-tax cash flow is $25,000. The investor’s initial cash investment is $200,000.
Using the formula:
$25,000 ÷ $200,000 = 0.125 or 12.50%
Example 2: Multi-Family Property
An investor buys a five-unit condo community with a $500,000 loan at 7% interest over 20 years. The property generates $10,000 per month in rental income ($120,000 annually), while monthly operating expenses are $4,000 ($48,000 annually). The loan payment is $3,500 per month ($42,000 annually). The annual pre-tax cash flow is calculated as:
$120,000 - $48,000 - $42,000 = $30,000.
If the total cash invested was $150,000, the cash-on-cash return is:
$30,000 ÷ $150,000 = 0.20 or 20.00%
Always double-check your numbers if something seems off. For example, confirm partial-year revenues if the property wasn’t rented out immediately or if there were mid-year rent adjustments due to market changes. Accurate data ensures your calculations reflect the true performance of your investment.
Transform Your Real Estate Strategy
Access expert financial analysis, custom models, and tailored insights to drive your commercial real estate success. Simplify decision-making with our flexible, scalable solutions.
How to Use Cash-on-Cash Return Results
Once you've calculated your cash-on-cash return, the next step is understanding what the numbers mean. This insight helps you decide whether to buy, hold, or pass on a property. By applying these benchmarks, you can better evaluate how this metric fits into your overall investment strategy.
Good vs. Poor Returns
What qualifies as a "good" cash-on-cash return varies depending on your goals, risk appetite, and the market you're operating in.
Standard Benchmarks
In general, a cash-on-cash return between 8% and 12% signals strong performance. Returns above 12% can be impressive but often come with increased risk. On the flip side, lower returns may still work for investors prioritizing stability and lower risk .
Market conditions also play a big role. Properties in high-demand areas often yield better returns, while less desirable markets might result in lower percentages. Commercial real estate tends to offer higher returns compared to residential properties, thanks to longer leases and higher rental rates. That said, it's crucial to compare returns within your specific market rather than relying solely on these broad benchmarks.
“A ‘good’ cash-on-cash return is always a relative number that is different for every investor and investment type.”
Property-Specific Expectations
Different types of properties come with their own return expectations. For instance, short-term rentals often aim for 8%-12%, while some investors in these properties look for returns of 15% or more to achieve strong cash flow. In some cases, returns can even hit 20% or higher, particularly in areas with high demand.
When to Use This Metric
Cash-on-cash return is most useful when your focus is on steady operating income rather than long-term appreciation. It’s particularly effective for assessing investments like commercial real estate with stable leases, multifamily properties that have already been stabilized, or turnkey investments with predictable cash flow.
“The cash-on-cash return is helpful when future cash flows are largely predictable and stable. It is less valuable for extensive renovation projects, development, or quick fix/flip projects that expect a significant refinance or sale shortly after closing.”
Real-World Applications
A retiree with $1,200,000 to invest in a long-term property might aim for at least 7.50% annual cash-on-cash return to generate $90,000 per year for living expenses.
A real estate private equity firm raising funds for a core investment strategy may target properties with a minimum 6.80% annual cash-on-cash return, ensuring steady quarterly distributions to its investors.
When to Look Beyond Cash-on-Cash Return
This metric has its limitations. For example, it’s not as relevant for fix-and-flip projects, ground-up developments, or major redevelopments. These types of investments often rely more on appreciation than consistent cash flow. In such cases, metrics like internal rate of return (IRR) or total return on investment might provide a clearer picture.
Integration with Other Metrics
To make well-rounded decisions, combine cash-on-cash return with other metrics like cap rates and IRR. Tools like The Fractional Analyst's financial models can help you analyze multiple metrics at once, ensuring your decisions are based on a complete picture rather than a single calculation.
Pros and Cons of Cash-on-Cash Return
Now that we've covered how to calculate and use cash-on-cash return, it's important to weigh its strengths and weaknesses. This metric's simplicity is both its biggest advantage and its main drawback, depending on how you look at it.
Cash-on-cash return offers a straightforward way to evaluate an investment's cash performance but comes with some notable limitations.
Benefits
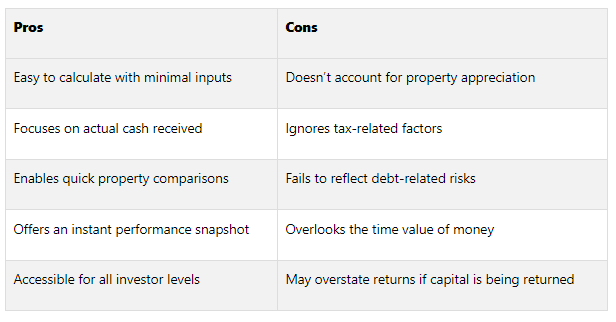
Straightforward and easy to use: It only requires two inputs - annual pre-tax cash flow and total cash invested - making it accessible to investors of all experience levels.
Focuses on actual cash flow: Unlike metrics that consider paper gains, this one zeroes in on the cash you’re actually receiving.
Useful for quick comparisons: It allows investors to easily compare the cash performance of different properties, especially in fast-moving markets.
Immediate performance insights: It provides a quick snapshot of how well an investment is performing from a cash perspective.
Drawbacks
Excludes property appreciation: While cash-on-cash return highlights cash yield, it doesn’t reflect the potential for property value growth over time.
Ignores tax factors: Important considerations like depreciation, interest deductions, and capital gains are left out of the equation.
Overlooks debt risks: A property with high leverage might show strong cash returns but carry significant financial risk, which this metric doesn’t capture.
No time value of money: It only looks at current performance, ignoring future cash flow changes or the effects of compounding.
Can misrepresent returns: If part of the cash flow comes from a return of capital rather than true profit, the metric might overstate the investment's yield.
Here’s a quick breakdown of the key pros and cons:
Savvy investors often pair cash-on-cash return with other metrics like cap rates and IRR for a more comprehensive analysis. Tools like those from The Fractional Analyst make it easier to evaluate multiple metrics at once for a fuller investment picture.
Conclusion
Understanding the cash-on-cash return formula is a must for any real estate investor aiming to make smart, data-driven decisions. This simple yet powerful metric shows how much cash flow your property generates compared to the cash you've invested, making it easier to evaluate and compare potential opportunities.
As Jasen Edwards, chair of the Agent Editor Board at Agent Advice, puts it:
“ROI encompasses the comprehensive return, incorporating the debt load, whereas cash-on-cash return solely evaluates the return on the invested cash, offering a more precise appraisal of the investment’s efficacy.”
The beauty of this formula lies in its simplicity - it only requires two inputs: annual pre-tax cash flow and total cash invested. Whether you're looking at your first rental property or a large commercial deal, this metric is easy to calculate and apply.
That said, while cash-on-cash return is incredibly useful for assessing your investment's cash performance, it’s most effective when paired with other metrics like cap rates and IRR. These additional tools help account for factors such as property appreciation, tax advantages, and long-term value - all elements that cash-on-cash return alone doesn’t capture. A well-rounded analysis ensures you’re evaluating every angle of your investment.
For those seeking deeper insights, The Fractional Analyst offers custom financial analysis services tailored to commercial real estate. Their expertise can help investors and property owners integrate cash-on-cash return into a broader financial strategy, ensuring no detail is overlooked in your investment evaluations.
FAQs
-
Cash-on-cash return zeroes in on the annual return based on the actual cash an investor has put into a property. It's a simple and effective way to gauge short-term profitability, making it especially useful for assessing immediate cash flow.
On the other hand, IRR (Internal Rate of Return) takes a broader view. It calculates the annualized return over the entire investment period, factoring in all cash flows, which gives investors a long-term perspective on their investment's performance.
Then there's the cap rate (capitalization rate), which looks at a property's potential income in relation to its market value at a specific moment. Unlike the other two metrics, it doesn’t account for financing or the timing of cash flows.
Each of these metrics serves a distinct purpose, and understanding their differences can help investors make smarter, more strategic decisions.
-
Investors sometimes stumble by overestimating income, underestimating expenses, or forgetting to account for all cash invested when figuring out cash-on-cash return. Overlooking essential factors like taxes, maintenance costs, and vacancy rates can also throw off calculations.
To steer clear of these slip-ups, stick to consistent and accurate numbers for annual pre-tax income and total cash invested. Make sure to account for every relevant expense, double-check your math with supporting documents, and consider using tools like rental property calculators for added precision. By focusing on details and keeping thorough records, you can ensure your calculations are far more reliable.
-
Evaluating cash-on-cash return alongside property appreciation gives you a complete picture of how a real estate investment is performing. Cash-on-cash return highlights the immediate cash flow and profitability, offering insight into the short-term financial health of the investment. Meanwhile, property appreciation tracks the long-term increase in the property's value, which can significantly enhance overall returns when you choose to sell or refinance.
By factoring in both metrics, you can strike a balance between generating short-term income and building long-term wealth, paving the way for smarter and more strategic investment decisions.