
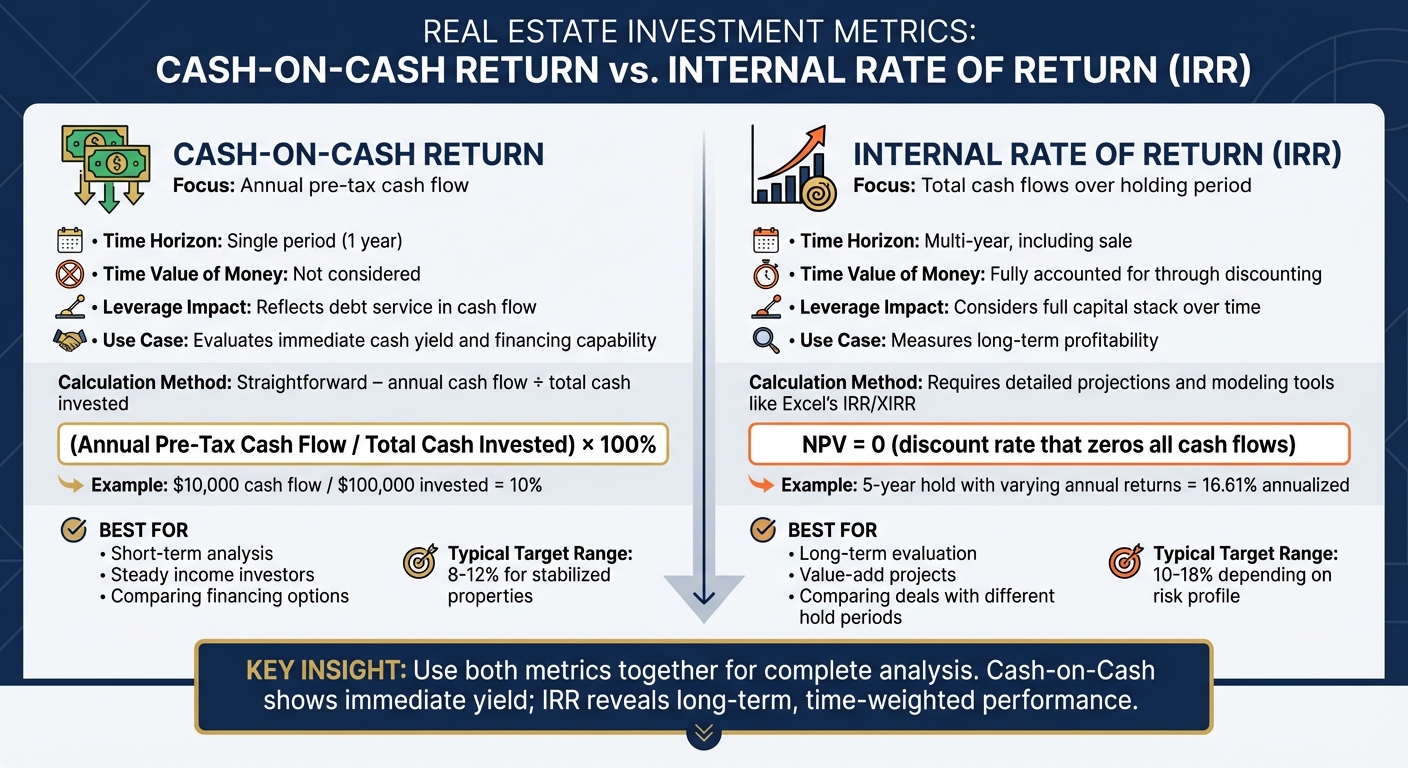
Cash-on-Cash vs. IRR: Key Differences

When analyzing real estate investments, cash-on-cash return and internal rate of return (IRR) are two essential metrics that serve different purposes:
- Cash-on-Cash Return: Focuses on the annual cash flow relative to the cash invested. It’s a simple way to measure short-term income, making it ideal for investors prioritizing steady yearly returns. For example, a $50,000 investment generating $5,000 in yearly cash flow delivers a 10% return.
- IRR: Measures the annualized total return over the entire investment period, accounting for all cash flows (e.g., rental income, appreciation, sale proceeds) and the time value of money. It’s better suited for evaluating long-term profitability and growth potential.
Key Takeaways:
- Cash-on-Cash Return: Best for short-term cash flow analysis and comparing financing options.
- IRR: Ideal for assessing overall investment performance over time, including appreciation and sale profits.
Both metrics are valuable, but they serve different goals. Use cash-on-cash return to gauge immediate yield and IRR to understand long-term returns. Together, they provide a clearer picture of an investment’s potential.
IRR or Cash-on-Cash Return and when to use which
What is Cash-on-Cash Return?
Cash-on-cash return is a metric that measures the annual cash income generated for every dollar of cash invested. Expressed as a percentage, it focuses exclusively on the cash flow you receive after covering mortgage or debt payments. Unlike other metrics that account for property appreciation or long-term profits, this one zooms in on the immediate cash yield your investment produces each year. This focus on current cash flow makes it particularly relevant for understanding its calculation and real-world applications.
Investors often rely on this metric because it directly shows how much cash they’re getting back annually for every dollar they’ve put in. It’s especially useful for income-driven strategies, such as investing in multifamily or commercial properties that involve financing. Since cash-on-cash return is a levered metric, it accounts for the effects of loans and debt payments, helping you see how financing influences your yearly returns.
This metric is also helpful when comparing different financing options. For instance, using leverage might increase your cash-on-cash return to 10%, compared to just 6.7% for an all-cash purchase. This shows how borrowing can amplify your cash yield when the property’s income exceeds the cost of the loan. In commercial real estate, many professionals aim for cash-on-cash returns in the 8%–12% range for stabilized properties, though these benchmarks depend on market conditions and individual risk tolerance. Let’s break down how to calculate this important metric.
How to Calculate Cash-on-Cash Return
The formula for cash-on-cash return is straightforward:
Cash-on-Cash Return = (Annual Pre-Tax Cash Flow / Total Cash Invested) × 100%
- Annual pre-tax cash flow is your net operating income (NOI) minus debt service.
- Total cash invested includes your down payment, closing costs, and any initial expenses.
Here’s a simple example to illustrate: Imagine you buy a $250,000 rental property with a $50,000 down payment. The property generates $30,000 in annual rent and has $5,000 in operating expenses, leaving you with an NOI of $25,000. If your annual mortgage payment is $15,000, your cash-on-cash return would be:
($25,000 - $15,000) / $50,000 × 100% = 20%
This means that for every dollar of your $50,000 investment, you’re earning $0.20 in annual cash flow.
Now, let’s see how leverage affects returns. Suppose you purchase a $6 million commercial property generating $400,000 in NOI. With $2 million in equity and $4 million in debt that requires $200,000 in annual debt service, your cash-on-cash return would be:
($400,000 - $200,000) / $2,000,000 × 100% = 10%
If you bought the same property with no debt, your return would drop to:
$400,000 / $6,000,000 × 100% = 6.7%
This example highlights how financing can significantly boost your cash yield when the property’s income comfortably exceeds the cost of borrowing.
What is Internal Rate of Return (IRR)?
Internal Rate of Return (IRR) is the annualized, compounded rate of return that makes the net present value (NPV) of all investment cash flows equal to zero. In simple terms, it’s the discount rate that balances your cash inflows and outflows, resulting in a net present value of zero. Unlike cash-on-cash return, which focuses on a single year’s cash flow, IRR considers your entire investment timeline - from the initial investment to annual distributions and the final sale proceeds.
What makes IRR particularly useful is its ability to account for the time value of money. This concept reflects the idea that money received sooner is worth more than money received later. IRR incorporates this by applying greater discounts to cash flows that occur further in the future. For U.S. real estate investments, which often span 5 to 10 years or more, this timing factor becomes crucial. For example, two deals might generate the same total profit, but the one that returns your capital faster will have a higher IRR because your funds are tied up for less time.
Investors often rely on IRR as a performance measure to compare deals with varying hold periods, leverage structures, and cash flow patterns. For instance, you might weigh a core multifamily property targeting a 10–12% IRR with steady cash flow against a value-add property aiming for a 15–18% IRR, which might involve lower early distributions but greater potential appreciation at the end. Institutional investors and sponsors frequently use IRR thresholds - such as a 12% preferred return or an 18% promote level - to determine how profits are split among partners.
IRR provides a comprehensive view of an investment’s performance by factoring in annual cash flow, debt repayment, and eventual sale proceeds. While cash-on-cash return focuses on yearly cash yield, IRR captures the broader picture, including changes in income, expenses, and refinancing impacts over time. This makes it especially valuable for evaluating long-term strategies where appreciation and refinancing play key roles alongside operating cash flow. Many investors use IRR in combination with cash-on-cash return and equity multiple to ensure a deal delivers both strong annual growth rates and sufficient total profits.
How to Calculate IRR
Calculating IRR involves finding the discount rate that makes the sum of all discounted cash flows equal zero. Since this creates a non-linear equation that’s challenging to solve algebraically with multiple periods, most professionals use tools like Excel’s =IRR() or =XIRR() functions or specialized financial software to handle the math.
Here’s how it works: Start by laying out a timeline of projected cash flows in U.S. dollars. This includes your initial investment at Year 0 (a negative value), the annual net cash flows after covering expenses and debt service (positive values), and the final cash flow from the property’s sale, which accounts for sale proceeds minus selling costs and any remaining loan balance.
Let’s break it down with an example. Suppose you invest $5,000 in a small multifamily property and receive these pre-tax cash flows:
- Year 1: $1,700
- Year 2: $1,900
- Year 3: $1,600
- Year 4: $1,500
- Year 5: $700 plus sale proceeds
Input the series: -$5,000 (initial investment), +$1,700, +$1,900, +$1,600, +$1,500, and the Year 5 total. Using Excel, the IRR calculates to about 16.61%, meaning your investment’s cash flows are equivalent to earning a compounded annual return of 16.61% over the 5-year period.
For larger commercial deals, the process is the same but involves bigger numbers. For example, if you’re analyzing a $6 million property with $2 million in equity and $200,000 in annual cash flow after debt service, you’d project those yearly distributions and the expected sale proceeds in Year 7 or Year 10. Excel or financial software can then compute the IRR. Analysts often run sensitivity tests by adjusting exit cap rates and hold periods to see how IRR changes under different scenarios. This helps you evaluate the range of potential returns before committing your capital.
Cash-on-Cash vs. IRR: Key Differences
Cash-on-Cash Return vs IRR Comparison Chart for Real Estate Investors
Cash-on-cash return and IRR measure two distinct aspects of real estate investments, each offering unique insights. Cash-on-cash return zeroes in on the annual pre-tax cash flow relative to the equity invested. It gives a straightforward view of the income a property generates in a single year, treating all cash flows equally, regardless of timing. IRR, on the other hand, takes a broader approach. It evaluates the overall annualized profitability of the investment over its entire holding period, factoring in all projected cash flows - including the proceeds from selling the property - and incorporates the time value of money. This fundamental difference shapes how these metrics are calculated and when they are most useful.
The calculation process for each metric varies in complexity. Cash-on-cash return is relatively simple to compute. You divide one year's cash flow by the total cash invested, which typically includes the down payment and closing costs. IRR, however, requires a more detailed analysis. It involves projecting all cash flows, including the initial investment, annual income, and eventual sale proceeds. Tools like Excel's IRR or XIRR functions - or specialized financial software - are often used to determine the discount rate that aligns these cash flows. Because of this, IRR relies heavily on the accuracy of assumptions about future income, expenses, and the property's exit value.
Another key difference lies in how each metric handles timing. IRR rewards early returns and penalizes delayed cash flows, while cash-on-cash return treats all dollars the same, no matter when they are received. For instance, a property requiring significant renovations might show low or even negative cash-on-cash returns in the early years but ultimately achieve a strong IRR after improvements and a profitable sale. On the flip side, a stable property generating consistent annual cash-on-cash returns of 8–10% could deliver a lower IRR if it lacks significant appreciation. This contrast is especially relevant for U.S. commercial real estate investors analyzing leveraged deals, underscoring the importance of using both metrics together to fully understand the balance of risk and reward.
Here’s a side-by-side comparison to highlight these differences:
Comparison Table: Cash-on-Cash vs. IRR
| Factor | Cash-on-Cash Return | Internal Rate of Return (IRR) |
|---|---|---|
| Focus | Annual pre-tax cash flow | Total cash flows over the holding period |
| Time Horizon | Single period (e.g., 1 year) | Multi-year, including sale |
| Time Value of Money | Not considered | Fully accounted for through discounting |
| Leverage Impact | Reflects debt service in cash flow | Considers the full capital stack over time |
| Use Case | Evaluates immediate cash yield and financing capability | Measures long-term profitability |
| Calculation Method | Straightforward: annual cash flow ÷ total cash invested | Requires detailed projections and modeling tools like Excel's IRR/XIRR |
sbb-itb-df8a938
When to Use Cash-on-Cash Return
Cash-on-cash return shines when you're evaluating Year 1 cash flow. It’s particularly useful for gauging how a property performs before factors like renovations or appreciation come into play. For instance, if a multifamily property generates $100,000 in net cash flow on a $1,000,000 equity investment, that translates to a 10% return for the year. This straightforward, single-year snapshot helps you determine if the property can handle debt payments while providing distributions, without having to wait for a sale. It’s also a great tool for comparing various financing structures to see which one aligns best with your goals. [1]
This metric is especially valuable when immediate liquidity is a priority. Investors who rely on steady annual payouts often use cash-on-cash return to confirm that a property can cover debt obligations and generate distributions. For example, a property with $500,000 in net operating income (NOI) after debt service could yield a 7.3% cash-on-cash return on equity, highlighting its ability to meet current liquidity needs rather than focusing on future sale proceeds. In stable U.S. markets, target returns for leveraged commercial properties typically fall between 8% and 12%, offering a practical benchmark for evaluating deals. [3][5]
Cash-on-cash return is also highly effective for comparing leveraged investments. It focuses solely on the return from your out-of-pocket cash, making it easier to evaluate properties with different financing structures. For example, if a property generates $45,000 in annual cash flow after debt service on $250,000 in equity, that’s an 18% return - an apples-to-apples way to compare deals regardless of their capital stacks. [2]
During underwriting, cash-on-cash return helps you project annual distributions and assess liquidity goals. By calculating it year-by-year, you can evaluate different financing options and ensure the deal aligns with your liquidity strategy without relying on complicated multi-year forecasts. Beyond underwriting, this metric is a key decision-making tool for investors with shorter time horizons.
For short-term or value-add investors, cash-on-cash return is indispensable when targeting quick returns. For instance, a rehabbed property generating $70,000 in cash flow on $135,000 in equity delivers a 51.9% Year 1 return - perfect for investors focused on immediate cash flow rather than long-term internal rate of return (IRR) that factors in eventual sale proceeds. While it doesn’t account for appreciation or the time value of money, it gives you a clear picture of whether a property’s income justifies the upfront investment. [6]
When to Use IRR
Cash-on-cash return is great for gauging immediate yield, but IRR (Internal Rate of Return) takes a broader view, measuring long-term profitability over the entire lifecycle of an investment. While cash-on-cash focuses on a single year's cash yield, IRR factors in the time value of money, considering all cash flows - from the initial equity investment to annual distributions, refinancing events, and the final sale proceeds. For example, a value-add project might show low early cash returns during renovations. However, once rents increase and the property is sold at a higher valuation, IRR can reveal a strong annualized return that a one-year cash-on-cash metric would overlook [6].
By converting all cash flows into a single annualized rate, IRR allows for easy comparisons between investments. It’s particularly useful when one deal offers modest early distributions but significant gains later, while another provides steady but lower returns overall. For instance, a deal with slightly higher early cash returns but a lower overall IRR may be less attractive than one with a stronger IRR, as the latter often reflects better property appreciation and equity growth [6].
For complex investments with irregular cash flows - like ground-up developments, construction projects with capital calls, staged lease-ups, or refinancing mid-hold - IRR is the go-to metric. These types of projects often generate little to no cash flow early on but can later deliver strong distributions and a substantial profit upon sale. IRR accounts for these fluctuations, making it ideal for such scenarios [6].
Experienced investors, including private equity real estate funds, pension funds, and institutional joint ventures, often target specific IRR ranges based on risk profiles (core, core-plus, value-add, or opportunistic) and fund requirements. They use IRR to ensure deals meet hurdle rates after factoring in fees and leverage. It’s also a key metric for ranking competing projects, especially when timing cash flows and exit strategies are critical. Additionally, IRR plays a pivotal role in structuring sponsor promote waterfalls, where carried interest is triggered at specific return thresholds [4].
In practice, U.S.-based investors typically use Excel or specialized software to calculate IRR. By inputting initial equity, projected annual cash flows, refinance timing, and anticipated sale proceeds (often based on an exit cap rate), they can use Excel's IRR or XIRR functions to determine annualized returns. These tools also allow for sensitivity testing by adjusting variables such as rent growth, vacancy rates, operating expenses, and exit pricing. For added efficiency, platforms like the Fractional Analyst and CoreCast offer pre-built models to streamline IRR calculations and comparisons [6].
Limitations of Cash-on-Cash Return and IRR
While both cash-on-cash return and IRR are widely used metrics, it’s important to recognize their limitations. Neither provides the complete picture on its own. For instance, cash-on-cash return overlooks the time value of money, which can lead to an overestimation of returns in deals with long, back-loaded cash flows[4]. Additionally, it only reflects a single period - typically one year - so it doesn’t capture how returns evolve over the entire holding period or after significant events like renovations or refinancing[3]. Another drawback is its narrow focus on annual cash flow, leaving out key factors like property appreciation, principal paydown, and sale proceeds[6].
IRR, on the other hand, has its own set of challenges. It is extremely sensitive to the timing and size of projected cash flows. Even small changes in assumptions - such as the speed of lease-up, the timing of an exit, or rent growth - can significantly alter the IRR[6]. Furthermore, IRR assumes that interim cash flows are reinvested at the same rate, which may not be realistic, especially for projects with very high IRRs[7]. Aggressive assumptions about exit cap rates or sale prices can also artificially inflate IRR, even when current cash flow is weak[3][2]. In some cases, this metric can favor short-term, higher-risk projects over more stable, long-term investments that might better match an investor's risk tolerance[3].
Here’s an example to illustrate: Property A might deliver higher early cash returns, while Property B, requiring renovations, might generate a stronger IRR after improvements. Cash-on-cash return would highlight Property A’s immediate yield, while IRR would reflect Property B’s enhanced long-term, time-weighted performance. Relying solely on one metric could lead to an incomplete or misleading evaluation of these properties.
Using both metrics together can provide a more balanced perspective. Cash-on-cash return offers a clear snapshot of the current income yield on equity, which is critical for investors seeking steady annual cash flow. Meanwhile, IRR evaluates the overall efficiency of capital deployment over the entire holding period, factoring in elements like cash flow timing, property appreciation, and sale proceeds[6][3]. For instance, a deal with a 7% cash-on-cash return and a 16% IRR might attract a growth-focused investor, while one offering a 10% cash-on-cash return and a 12% IRR could appeal to someone prioritizing consistent income.
To avoid overly optimistic projections skewing IRR, professional analysis - like independent underwriting and robust financial modeling - can be invaluable[6][3]. These limitations highlight why it’s essential to consider both metrics together to align with your specific investment goals.
Conclusion: Choosing the Right Metric for Your Investment Strategy
Neither cash-on-cash return nor IRR tells the full story on its own. Think of cash-on-cash return as your go-to when consistent annual income is your priority. It’s straightforward and provides a clear picture of the annual cash yield per dollar invested. For investors focused on steady cash flow - like retirees, income-focused individuals, or those managing long-term holdings with stable distributions - cash-on-cash return is key. Many U.S. investors aim for a benchmark of 8%–12% annually for this metric[5].
On the other hand, building long-term wealth calls for a broader perspective. That’s where IRR becomes essential, especially when evaluating value-add deals, repositioning strategies, or investments with varying hold periods. Growth-oriented investors, such as sponsors targeting a 3–7 year exit, often prioritize IRR. It accounts for the time-weighted impact of improvements and sale proceeds. For these investors, it’s common to screen deals using a minimum cash-on-cash return benchmark (around 7%–8% in the first year) and then rank opportunities by IRR to assess risk-adjusted total returns[3][8].
Using both metrics together provides a well-rounded view. For example, a deal with an 18% cash-on-cash return but a modest IRR might appeal to an income-focused investor, while another offering an 8% cash-on-cash return in year one but a strong IRR after value-add improvements could attract a growth-focused buyer[6][2]. Before committing capital, it’s wise to test multiple scenarios - adjust for interest rates, vacancy rates, and exit cap rates - and cross-check both metrics against debt coverage ratios and equity multiples. This helps avoid overly optimistic projections[2][4].
To make this process more effective, having the right tools and expertise is crucial. The Fractional Analyst supports U.S. commercial real estate investors by providing tailored underwriting and financial modeling. Their pro formas calculate cash-on-cash return and IRR under various scenarios - base, downside, and upside - factoring in realistic U.S. financing terms, rent growth, and exit strategies. For those who prefer a self-service approach, their CoreCast real estate intelligence platform and free financial models let you input property-specific data, compare deals side by side, and generate investor-ready reports that clearly present both metrics, helping you make informed decisions.
Ultimately, success comes down to aligning your goals - whether they lean toward current income or long-term growth. Define your priorities, set minimum cash-on-cash and target IRR thresholds that fit your risk tolerance, liquidity needs, and time horizon, and rely on professional tools and expert insights to validate your assumptions. This ensures your chosen metrics align with your broader portfolio strategy[3][6].
FAQs
What’s the difference between cash-on-cash return and IRR when assessing investment risk?
Cash-on-cash return zeroes in on short-term performance, offering a clear snapshot of the immediate cash income as a percentage of your initial investment. It’s a simple and effective way to gauge liquidity and assess short-term risks.
In contrast, IRR (Internal Rate of Return) takes a wider lens, evaluating the total return across the entire life of an investment. It also accounts for the timing of cash flows, making it a more detailed tool for understanding long-term risks and overall profitability.
These metrics cater to different needs: cash-on-cash return helps you grasp short-term cash flow, while IRR digs deeper into the long-term potential and overall success of the investment.
When is cash-on-cash return more useful than IRR for real estate investors?
Cash-on-cash return proves to be a better tool than IRR when the primary concern is short-term cash flow or assessing liquidity. It works especially well for stabilized or uncomplicated properties where the timing of cash flows isn’t a pressing issue, giving investors a straightforward look at the immediate returns on their invested money.
This measure is perfect for those who value consistent income or need to evaluate how quickly their initial investment starts generating cash.
What tools can simplify IRR calculations for complex real estate investments?
When dealing with intricate real estate investments, tools like financial modeling software and the CoreCast platform can simplify IRR (Internal Rate of Return) calculations. These resources are designed to deliver precise and efficient insights, specifically tailored for commercial real estate analysis.
With the support of cutting-edge technology and expertly crafted tools, you can assess investment performance with confidence and make well-informed decisions.