
Equity Discount Rate vs. Debt: Impact on Valuation

In commercial real estate, equity discount rates and debt discount rates are key to understanding property valuation. These rates reflect the return expectations of equity investors and lenders, respectively, and directly impact how future cash flows are discounted to determine a property's present value. Here's the core takeaway:
- Equity Discount Rate: Reflects the higher risk of equity investments, typically ranging from 12% to 20%. It accounts for factors like market volatility, property-specific risks, and economic conditions.
- Debt Discount Rate: Lower than equity rates, usually 4% to 8%, due to debt's senior position in the capital stack and tax-deductible interest payments.
Both rates influence the Weighted Average Cost of Capital (WACC), a critical metric for evaluating property performance. A higher WACC decreases property value, while a lower WACC increases it. Investors and lenders use these rates to make informed decisions about acquisitions, financing, and risk management.
Understanding the relationship between equity and debt rates, along with their role in WACC, is essential for accurate property valuation and strategic investment planning.
WACC, Cost of Equity, and Cost of Debt in a DCF
sbb-itb-df8a938
What Makes Up Equity Discount Rates
Equity discount rates in commercial real estate are determined using the build-up method. This method starts with a base rate and adds various risk premiums to account for the specific uncertainties that investors face. The formula looks like this: Risk-Free Rate + Equity Risk Premium + Size Premium + Industry Risk Premium + Specific Company Risk Premium [9].
Each part of the formula addresses a distinct type of risk. The risk-free rate serves as the baseline - the minimum return an investor can expect with virtually no risk. From there, additional premiums are layered on to account for market volatility, investment size, industry-specific challenges, and risks unique to the property or company. For example, the industry risk premium, which is often relatively small, adjusts for sector-specific volatility in commercial real estate (CRE). Typically, equity discount rates for CRE transactions range between 8% and 12% [10], though this can vary based on market conditions and property characteristics.
Risk-Free Rate and Equity Market Premium
The risk-free rate (RFR) is the starting point for calculating equity discount rates. In the U.S., this is generally represented by the yield on 10-year or 30-year U.S. Treasury bonds [9][8]. These government bonds are considered virtually risk-free, making them the benchmark for the lowest possible return an investor can expect without taking on additional risk.
Above the risk-free rate sits the equity risk premium (ERP), which represents the extra return investors demand for choosing equity investments over safer government bonds. This premium compensates for the uncertainty and volatility inherent in equity markets. For instance, during periods of economic turbulence, the equity risk premium often rises. A clear example of this occurred in early 2020 when the COVID-19 pandemic caused widespread market uncertainty. At that time, Duff & Phelps increased the recommended U.S. Equity Risk Premium from 5.0% to 6.0% [9]. Historically, the equity risk premium for CRE has ranged between 3% and 10% [8], reflecting shifts in market confidence and economic conditions.
Following the ERP, additional premiums are applied to account for investment size and specific risks tied to individual properties or companies.
Size Premium and Company-Specific Risks
Beyond general market risks, certain premiums address factors unique to individual investments. The size premium accounts for the higher risks associated with smaller companies or properties. Investors demand higher returns for small-cap investments because these entities often have less financial stability and are more vulnerable to market fluctuations [9].
The specific company risk premium (SCRP) focuses on risks that are unique to a particular property or entity [9]. These risks include operational challenges such as limited management depth, reliance on key personnel, tenant or customer concentration, and the property’s financial history. For instance, a Class A property in a central business district is likely to have a lower risk premium compared to a Class B property in a suburban area. Why? Class A properties usually offer more stable tenants and better market liquidity [1]. On the other hand, properties facing near-term lease expirations or requiring significant capital expenditures will have higher discount rates to reflect the added uncertainty [1].
How Debt Discount Rates Work
Debt discount rates are often lower than equity rates, primarily because of their seniority and tax advantages. These rates are calculated starting with a risk-free base rate, like the 10-year Treasury yield, and then adding a credit spread that reflects the borrower's creditworthiness and the specific risks of the property [1][12]. For instance, in early 2025, the 10-year Treasury rate dropped to 3.88% amidst market fluctuations, setting a benchmark for debt pricing across the industry [15].
Debt's lower rates stem from its priority in the capital stack. Debt holders get paid first - right after operating costs - before any cash flows reach equity investors. Mercer Capital explains:
Debt capital providers are paid before equity capital providers... Because equity investors come last, they require the highest rate of return in order to provide equity capital to a business [13].
This seniority reduces risk for debt holders. Unlike equity, which depends on residual cash flows, debt is a fixed contractual obligation, making it inherently less risky and justifying its lower required return.
Another important factor is the tax-deductibility of interest payments. Businesses can deduct interest payments on loans or bonds, which reduces the effective cost of borrowing. Heather B. Jourdan of Carr, Riggs & Ingram highlights:
Debt financing is treated favorably under U.S. tax law. Businesses can deduct the interest payments they make on their loans or bonds, which lowers the overall cost of financing [16].
This tax advantage is factored into the Weighted Average Cost of Capital (WACC) formula as: Cost of Debt × (1 - Tax Rate) [11].
Interest Costs and Credit Risk
The interest rate on commercial real estate debt is determined by two components: the base rate and the credit spread. The credit spread reflects the lender's compensation for the risk of borrower default and varies based on the borrower's financial health and the property's income stability [12].
Creditworthiness is critical here. Lenders assess factors like tenant quality, lease terms, occupancy rates, and the property's historical cash flow. For example, a Class A office building with investment-grade tenants on long-term leases will have a narrower credit spread compared to a higher-risk retail property with short-term leases. By late 2025, credit spreads in the commercial real estate sector widened by about 15 basis points (bps) compared to January 2025, reflecting slightly tighter lending conditions [14].
Capital Stack Position and Tax Benefits
Debt's position in the capital stack also influences its cost. Senior debt, which has the first claim on cash flows, carries the lowest risk and, therefore, the lowest interest rate. In contrast, subordinate debt or mezzanine financing, which sits below senior debt but above equity, involves higher risk and demands higher returns [13].
The tax benefits of debt further reduce its effective cost. For example, a 6% debt rate drops to 4.5% after-tax for a borrower in a 25% tax bracket, thanks to interest deductions. Equity investors, on the other hand, cannot deduct their returns and may face double taxation in some cases [16]. Additionally, the "One Big Beautiful Bill Act" (OBBBA) of 2025 enhanced these tax benefits by loosening interest deduction limitations for commercial real estate, allowing more flexibility in borrowing [17].
Equity vs. Debt Discount Rates: A Comparison
Equity vs Debt Discount Rates in Commercial Real Estate
Equity and debt discount rates represent two distinct positions in the capital stack, each reflecting differing levels of risk and return. Equity rates correspond to junior, first-loss positions, while debt rates are tied to senior, secured claims. Debt holders enjoy a secured position with fixed interest payments that take precedence over equity holders, who bear the first-loss exposure. As Altus Group succinctly puts it:
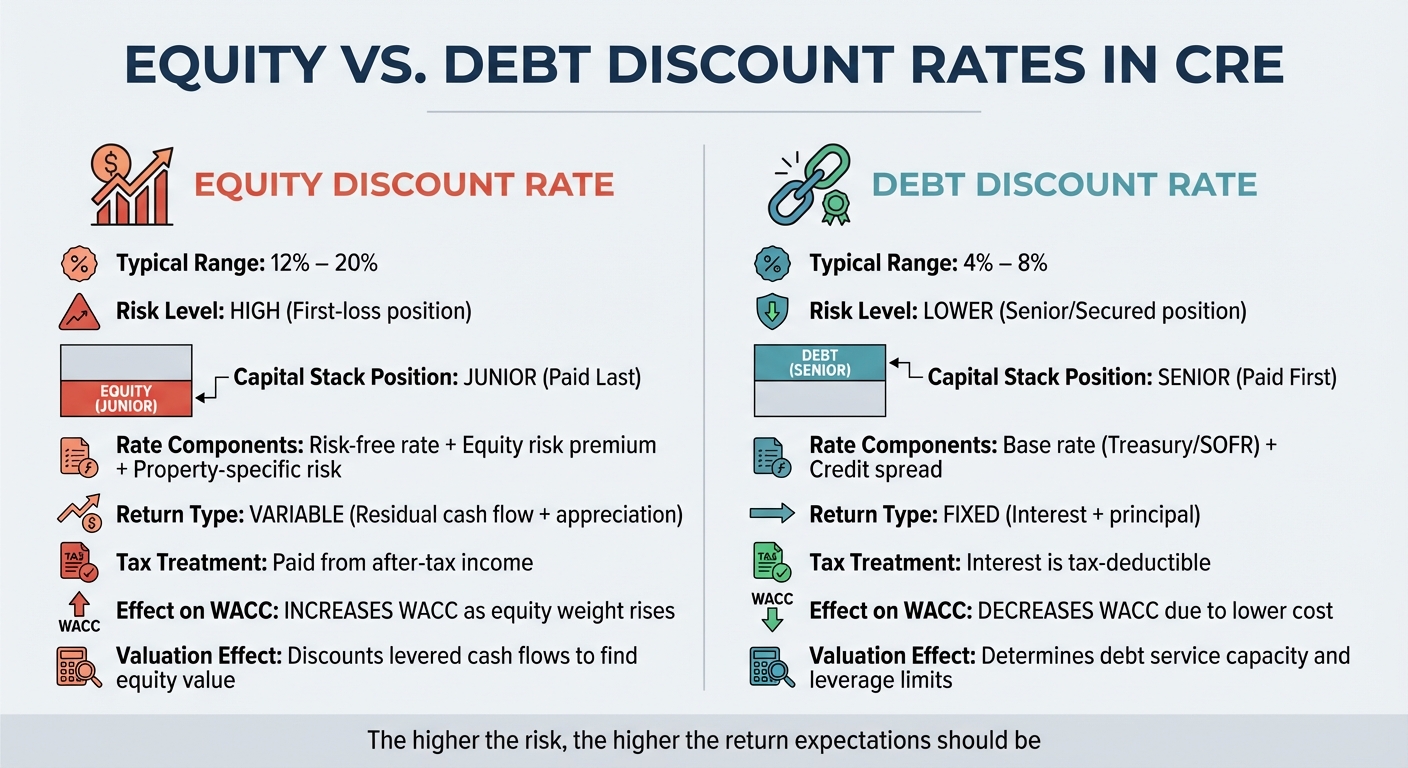
The higher the risk, the higher the return expectations should be [1].
This hierarchy of risk explains the difference in rates. Equity investors face the possibility of losing their entire investment if property values drop below the loan balance. In contrast, debt holders maintain a priority claim, which makes their position less risky. Consequently, equity discount rates for value-add and opportunistic investments typically range from 12% to 20%, while debt discount rates, reflecting their lower risk, usually fall between 4% and 8% [2].
The nature of returns also sets the two apart. Debt provides predictable, fixed interest payments based on a set schedule, regardless of property performance. Equity, on the other hand, offers variable returns that depend on property cash flows, appreciation, and the success of the investment strategy. This variability demands a higher return to compensate equity investors for the added risk [2].
Comparison Table: Equity vs. Debt Discount Rates
| Feature | Equity Discount Rate | Debt Discount Rate |
|---|---|---|
| Typical Range | 12% – 20% | 4% – 8% |
| Risk Level | High (First-loss position) | Lower (Senior/Secured position) |
| Rate Components | Risk-free rate + equity risk premium + property-specific risk [1] | Base rate (Treasury/SOFR) + credit spread [2] |
| Capital Stack Position | Junior (Paid last) | Senior (Paid first) |
| Return Type | Variable (Residual cash flow + appreciation) | Fixed (Interest + principal) |
| Tax Treatment | Paid from after-tax income | Interest is tax-deductible [18] |
| Influence on WACC | Increases WACC as equity weight rises | Decreases WACC due to lower cost [5] |
| Valuation Effect | Discounts levered cash flows to find equity value | Determines debt service capacity and leverage limits [2] |
Both equity and debt discount rates play a significant role in determining the weighted average cost of capital (WACC), a key metric for evaluating property value. Even small changes in these rates can have a noticeable impact. For investors, these shifts might influence acquisition decisions, while for lenders, they affect loan-to-value ratios and the overall safety of the loan [2]. Understanding these distinctions is crucial, as they directly shape the financial dynamics of property valuation.
Weighted Average Cost of Capital (WACC) in Real Estate Valuation
WACC plays a key role in combining the costs of equity and debt into a single metric for evaluating property value. It represents the average return that all capital providers - both lenders and equity investors - expect from their investment. In commercial real estate, WACC is used as the discount rate to calculate the net present value (NPV) of unlevered free cash flows and the terminal value of a property [19]. This method evaluates the entire asset rather than just the equity portion.
To ensure accuracy, WACC calculations rely on market weights rather than book values, as market values better reflect the actual economic claims of equity and debt [19]. Macabacus explains:
The discount rate is a weighted-average of the returns expected by the different classes of capital providers (holders of different types of equity and debt), and must reflect the long-term targeted capital structure as opposed to the current capital structure. [19]
WACC also acts as a benchmark for investment decisions. If a property’s internal rate of return (IRR) is below its WACC, the investment is generally not advisable [21]. For commercial real estate deals, WACC-derived discount rates typically range between 8% and 12% [10]. This approach aligns financing costs with expected cash flows, leading to more accurate property valuations.
WACC Formula and Calculation
The WACC formula combines the weighted costs of equity and debt:
WACC = (E/V × Re) + (D/V × Rd × (1 - Tc))
- E: Market value of equity
- D: Market value of debt
- V: Total value (E + D)
- Re: Cost of equity
- Rd: Cost of debt
- Tc: Corporate tax rate [20]
This formula highlights how each component affects the overall cost of capital. The tax component (1 - Tc) is particularly important because interest payments on debt are tax-deductible, while equity dividends are not. This tax shield reduces the cost of debt. For example, if a property is financed with 70% debt at 5% and 30% equity at 8%, the pre-tax WACC is 5.9%. With a 25% tax rate, the after-tax cost of debt drops to 3.75%, lowering the WACC to 5.0% [10].
Adjustments in capital structure directly influence WACC. Increasing the share of debt usually reduces WACC, as debt is typically cheaper than equity - provided the risk of financial distress remains under control [2]. However, excessive leverage can backfire, driving up the costs of both debt and equity due to heightened default risk.
For long-term valuations, it’s critical to use the targeted capital structure rather than the current one, as the latter may be temporary [19]. Additionally, for firms with large cash reserves, using net debt (total debt minus cash and equivalents) can yield a more precise estimate [22].
How WACC Affects CRE Valuation
WACC has a direct impact on property valuations through its role as the discount rate for future cash flows. A lower WACC increases property value, while a higher WACC reduces it. This creates a balancing act: while debt may lower WACC due to its lower cost, it also raises financial risk.
Higher real interest rates lead to increased borrowing costs, raising WACC and, consequently, lowering property values [3]. For example, gateway markets tend to have discount rates approximately 89 basis points lower than non-gateway markets, reflecting their lower perceived risk and greater liquidity [3]. The relationship between WACC and capitalization rates also serves as a useful comparison. Under stable growth conditions, the discount rate roughly equals the cap rate plus the expected growth rate [2]. Many real estate professionals use the "Band of Investment" method, a variation of WACC, to estimate an overall capitalization rate based on the weighted average of mortgage constants and required equity returns [2].
As Robert S. Harris of the University of Virginia’s Darden School of Business explains:
The WACC approach focuses on operating considerations. Financing concerns are handled via the discount rate. [18]
This underscores that WACC accounts for a property’s financing structure without requiring separate adjustments to cash flows. Even small changes in WACC can have a significant impact on valuations, making precise calculations essential for informed investment decisions [2].
Research Findings on Discount Rates in CRE
Market Benchmarks and Risk-Return Profiles
Research indicates that discount rates vary significantly depending on the market and property type. For instance, gateway markets like New York and other major metropolitan areas tend to have discount rates about 89 basis points lower than non-gateway markets [7]. This difference reflects the stronger liquidity and stability typically found in prime markets. Similarly, capitalization rates in gateway markets are about 93 basis points lower than those in non-gateway areas [7].
Macroeconomic conditions play a big role in shaping these rates. Rising real interest rates, for example, tend to push both discount and capitalization rates higher [7][3]. On the flip side, economic growth - measured by Real GDP - can lower discount rates over time by reducing the risk premiums investors demand [7][3]. Inflation, while initially driving rates up, eventually stabilizes as rents adjust [7][3]. These findings highlight how sensitive discount rates are to broader economic shifts.
The type of property strategy also influences risk-return profiles and associated discount rates. Core properties, which are stabilized, high-quality assets in primary markets, typically carry the smallest premiums over the 10-year U.S. Treasury yield. In contrast, value-add properties - those requiring renovations or improved management - carry moderate premiums tied to growth potential. Opportunistic investments, such as development projects or distressed assets, demand the highest premiums due to their elevated risks [1]. These benchmarks provide a framework for understanding how different property strategies align with market dynamics.
Data from Institutional Investor Studies
These benchmarks help contextualize broader investment trends in U.S. commercial real estate. By 2026, the sector is expected to stabilize, with investment activity projected to rise by 16%, reaching an estimated $562 billion [24]. This growth reflects renewed confidence as market pricing adjusts and capital flows return.
Michelle Herrick, Head of Commercial Real Estate at J.P. Morgan, commented on the improving outlook:
The 2026 market is strong from both a capital and fundamental standpoint - we anticipate more transactions in the coming year [23].
Kevin Thorpe, Chief Economist at Cushman & Wakefield, added:
As we head into 2026, the tone has shifted meaningfully... Capital is flowing again, interest rates are moving lower, and leasing fundamentals are generally stabilizing or improving [27].
Capitalization rates are expected to compress by 5–15 basis points in 2026, indicating tighter valuations [24]. Fixed-rate mortgage rates, however, are projected to remain relatively high, hovering at 6% or more throughout the year [26], which will keep borrowing costs steady. Meanwhile, the spread between government and corporate bond yields has narrowed to about 100 basis points, a signal that often precedes increased real estate investment and strengthening prices [27]. Lending activity in commercial real estate rose by 35% year-over-year as of late 2025, with multifamily debt markets standing out due to a 20.5% increase in lending caps for government-sponsored enterprises [23][27].
Analysts describe the market as experiencing "decaf stagflation" - a mix of below-trend economic growth and persistent inflation. This environment limits sharp interest rate cuts, keeping discount rates relatively stable [25]. In 2026, returns are expected to be largely income-driven, with asset selection and management playing a critical role in differentiating outcomes across core and value-add properties [24]. These subtle shifts in discount rates underscore their significant impact on commercial real estate valuation.
Conclusion
Understanding the distinct roles of equity and debt discount rates is key to accurately valuing commercial real estate. Equity discount rates account for the higher risks tied to junior capital positions, requiring a premium return. On the other hand, debt discount rates focus on interest costs and credit risk, reflecting their senior and secured nature [5][6].
The Weighted Average Cost of Capital (WACC) combines these rates, offering a clear picture of financing costs. If an asset's expected return falls below the WACC, it indicates the asset isn't generating value [5][6].
Different stakeholders approach these rates with varying priorities. Investors are concerned with total returns and equity multiples, while lenders emphasize debt service coverage and risk mitigation. Appraisers and residential valuators further refine these metrics. By using methods like the Band of Investment, market extractions, and investor surveys, discount rates can be triangulated for greater accuracy [2][4].
Even small shifts in discount rates can have a substantial impact on property valuations, particularly for high-value assets.
To navigate these complexities, reliable analytical tools are essential. The Fractional Analyst (https://thefractionalanalyst.com) provides tailored underwriting solutions, CoreCast's real-time scenario modeling, and free Excel templates designed to help investors and asset managers apply discount rates effectively across various property types. In today’s income-focused market, having the right tools and framework can make all the difference.
FAQs
When should I use WACC vs. an equity discount rate?
When evaluating a firm or project that relies on both debt and equity financing, Weighted Average Cost of Capital (WACC) and the equity discount rate serve different but complementary purposes.
- WACC: This metric offers a broad perspective, combining the costs of both debt and equity financing. It reflects the overall risk and return expectations for the entire capital structure, making it ideal for assessing the total value of a project or firm.
- Equity Discount Rate: This focuses exclusively on the equity portion. It’s used to evaluate the specific risks and returns associated with equity investors, without factoring in debt.
In short, WACC gives you the complete picture, while the equity discount rate zooms in on equity-specific considerations. Both tools are essential, depending on whether you're analyzing the firm as a whole or just the equity component.
How do I estimate the right credit spread for a CRE loan?
To determine the appropriate credit spread for a commercial real estate (CRE) loan, it's essential to evaluate market trends, apply triangulation methods, and factor in risk premiums tied to the asset type and leverage levels. Credit spreads can differ depending on loan-to-value (LTV) ratios and the specific asset category. Additionally, current interest rates influence spreads, as they tend to tighten when the market adjusts for risk.
How does leverage affect a property’s valuation?
Leverage has the potential to boost a property’s valuation by enhancing returns for equity investors. Yet, according to valuation theory, the market value of a property is generally unaffected by its capital structure, except when factoring in tax advantages.