
How Sensitivity Analysis Impacts Real Estate Valuations
Sensitivity analysis helps real estate investors understand how changes in key factors like rental income, interest rates, or operating expenses affect property performance. It’s a way to test financial models under different scenarios - best-case, worst-case, and base-case - so you can assess risks, identify opportunities, and make better decisions.
Key Takeaways:
Risk Assessment: Small changes in variables (e.g., a 1% interest rate increase) can significantly impact cash flow and ROI.
Common Issues: Market volatility and faulty assumptions (e.g., overestimating occupancy rates) often lead to inaccurate valuations.
Practical Use: Tools like Excel or automated platforms can model scenarios, while advanced methods (e.g., Monte Carlo simulations) analyze complex interactions.
Focus Areas: Cap rates, vacancy rates, and operating expenses are critical for accurate forecasting.
By regularly updating assumptions and using sensitivity analysis, you can better navigate uncertain markets and improve your investment strategies.
Sensitivity Analysis - What-If Scenarios In Real Estate Financial Modeling
Common Real Estate Valuation Problems
Real estate valuation is anything but straightforward. Numerous challenges can disrupt even the most meticulously crafted financial models. These issues often stem from unpredictable market conditions and the difficulty of making accurate forecasts. Let’s break down two key areas where valuation problems tend to arise: market changes and unreliable assumptions.
Market Changes and Uncertainty
One of the biggest hurdles in real estate valuation is dealing with market volatility. Factors like interest rates, rental demand, and economic trends can shift unexpectedly, throwing off initial projections. For instance, even small changes in interest rates can ripple through property cash flows and cap rates, altering the financial outlook. Local employment trends or population shifts can quickly influence rental demand, while properties in global cities are often exposed to larger economic shocks and international market fluctuations.
This uncertainty doesn’t stop at market trends. Financing, construction, and operating budgets often face unexpected changes. A property that seemed like a solid investment can suddenly face challenges due to zoning updates, local development projects, or broader economic events. These variables make it incredibly difficult to pin down reliable valuations.
Unreliable Model Assumptions
Market shifts are only part of the problem. Many valuation errors arise from faulty assumptions baked into financial models. Discounted cash flow (DCF) models, for example, depend on accurate inputs like occupancy rates, cap rates, construction costs, and operating expenses. Even small miscalculations can lead to massive valuation errors.
Take occupancy rates as an example. Many investors assume unrealistically high occupancy levels, overlooking factors like tenant turnover, seasonal fluctuations, and leasing delays. This overly optimistic outlook can inflate cash flow projections. Similarly, operating expenses often get underestimated. Property taxes, insurance, maintenance, and utilities frequently rise faster than expected, and major capital expenditures - like replacing HVAC systems or undertaking large renovations - can eat into profits if not properly accounted for.
Construction costs are another common pitfall. A project that looks profitable on paper can become a financial strain if actual expenses exceed initial estimates. Misjudging these costs can turn a promising investment into a marginal one.
Accurate cash flow projections are critical, especially when seeking financing. Lenders and investors rely on these forecasts to assess risk. If your numbers don’t hold up, it can undermine their confidence and limit your access to future funding. Consistent errors in assumptions not only impact individual deals but can also damage your reputation with equity partners and financial institutions. Trust in your projections is essential for maintaining credibility and securing long-term investment opportunities.
How Sensitivity Analysis Reveals Risks and Opportunities
Navigating market volatility and unreliable assumptions can feel like walking a tightrope. That’s where sensitivity analysis steps in - it helps identify risks you can manage and areas where you can improve outcomes. This method turns uncertainty into actionable insights, allowing you to spot potential pitfalls and capitalize on opportunities before they impact your finances.
Measuring Risk Impact
Sensitivity analysis works by tweaking individual variables in your financial model to see how those changes affect key metrics like Net Present Value (NPV) and Internal Rate of Return (IRR).
For instance, even small shifts can have big consequences. A 1% increase in interest rates might shrink cash flow by thousands of dollars annually, which could significantly hurt your ROI. If you're dealing with a 30-year fixed mortgage, that same 1% rise could mean 10% higher monthly payments. On the other hand, a 5% drop in property prices could result in major losses for those banking on appreciation.
Take this example from a multifamily property investment in Toronto: A $4 million property brought in $400,000 in annual rental income with $120,000 in operating expenses. Through sensitivity analysis, the investor discovered that a 5% increase in rental income would add $20,000 to cash flow, boosting the cash-on-cash return by 1.5%. However, a 1% uptick in interest rates meant an extra $28,000 in yearly mortgage payments, cutting the IRR by 2%. Meanwhile, a 10% rise in operating expenses increased costs to $132,000, lowering net operating income by $12,000 and reducing profitability. Armed with these insights, the investor locked in a fixed-rate mortgage and implemented cost-saving measures.
Operating expenses also demand close attention. A 5% increase in expenses can shrink net operating income (NOI) by 3–5%. Even a modest $5,000 annual rise could decrease ROI by 2–3%.
These insights highlight which variables are most critical to your investment’s success, helping you focus on what truly matters.
Finding the Most Important Valuation Factors
Not all factors are equally important when it comes to your investment’s performance. Sensitivity analysis acts like a magnifying glass, showing you which variables deserve the most attention and resources.
This tool is especially useful in real estate, where it helps forecast financial outcomes and identify the factors that significantly influence a project’s viability. For example, understanding how operational changes affect cash flow can guide decisions on resource allocation, operational improvements, and asset management.
One standout factor is the cap rate. A 1% increase in the cap rate can reduce a property’s value by hundreds of thousands of dollars, depending on its NOI. Construction costs are another major concern - if they rise by 10%, a development project could become financially unfeasible.
Vacancy rates also play a big role, especially in unpredictable markets. Sensitivity analysis helps assess how occupancy changes affect financial performance. For example, a 10% drop in rental income could cut ROI by several percentage points, emphasizing the importance of strong occupancy management.
Interest rate fluctuations are another area to watch closely. Sensitivity analysis can help you understand how changing rates affect financial obligations and returns. This is particularly important when evaluating the Debt Service Coverage Ratio (DSCR), a key metric for assessing the risk of real estate loans and making smarter financing decisions.
When Sensitivity Analysis Falls Short
While sensitivity analysis is a powerful tool, it has its limits. Traditional single-variable analysis focuses on how changing one factor impacts your investment while keeping everything else constant. But in the real world, variables often interact. For example, rising interest rates might coincide with shifts in rental income, operating expenses, and cap rates. Ignoring these interactions could lead to incomplete or misleading conclusions.
That’s where advanced methods come into play. Scenario analysis lets you model how multiple variables might change together under different market conditions - like a recession, growth period, or stable environment. Monte Carlo simulations take it a step further by running thousands of iterations with randomly varying inputs, giving you a broader view of possible outcomes.
These advanced approaches help answer bigger questions, like, “What’s the probability of hitting our target returns under different market conditions?” For complex investments or volatile markets, this deeper dive can be the difference between a well-calculated risk and an expensive mistake.
The choice of method depends on the complexity of your investment and your tolerance for risk. Simple sensitivity analysis works well for straightforward deals in stable markets. But for development projects or investments in less predictable markets, more sophisticated tools are often worth the effort.
Transform Your Real Estate Strategy
Access expert financial analysis, custom models, and tailored insights to drive your commercial real estate success. Simplify decision-making with our flexible, scalable solutions.
How to Perform Effective Sensitivity Analysis
Conducting a meaningful sensitivity analysis goes beyond tweaking a few numbers. It requires a structured approach that includes building adaptable models, using the right tools, and grounding your assumptions in reality. Here’s how to make your analysis both precise and actionable.
Building Flexible Financial Models
The foundation of effective sensitivity analysis is a well-constructed financial model that can easily adjust to different scenarios. Start by creating a dynamic DCF model with input fields that automatically update calculations when key variables change.
Set up a dedicated section for assumptions - such as rental growth, vacancy rates, cap rates, and interest rates - separate from your calculations. This way, testing a 2% increase in vacancy rates, for example, becomes as simple as changing one cell rather than digging through multiple worksheets.
Your model should include essential metrics like Net Present Value (NPV), Internal Rate of Return (IRR), cash-on-cash returns, and Debt Service Coverage Ratio (DSCR). These metrics should automatically recalculate as you adjust inputs, ensuring you always have up-to-date insights.
Use data validation to keep inputs realistic - like setting vacancy rates between 0% and 50% or cap rates from 3% to 15%. Additionally, include projections for multiple time frames. A 10-year forecast, for instance, allows you to see how changes compound over time, while a shorter 5-year projection might miss key long-term trends.
Once your flexible model is ready, enhance your analysis with the right tools and visual aids.
Using Analysis Tools and Software
After building a solid model, take your analysis further with specialized tools. Excel data tables are a great way to test multiple scenarios automatically, saving you from manually changing inputs over and over.
Visual tools like tornado charts and spider charts provide powerful insights into how different variables affect your outcomes. Tornado charts are especially useful for identifying which factors have the most influence on your returns.
“In a decision situation, sensitivity analysis helps you determine which of your input assumptions are critical so that you know where to focus your effort for gathering more information or reducing uncertainty.”
While tornado charts excel at showing the impact of individual variables, spider charts are better for scenarios where sensitivity variables are expressed as percentages. Choose the visualization that best fits your analysis and audience.
For a more streamlined approach, platforms like CoreCast from The Fractional Analyst automate much of the process. CoreCast integrates current market data directly into your analysis, eliminating the need to build models from scratch and helping you focus on interpreting results.
The Fractional Analyst also offers free financial models pre-designed with sensitivity analysis features. These models, tailored for multifamily acquisitions and mixed-use developments, save time and reduce errors, giving you a head start on your analysis.
Checking and Updating Your Assumptions
Even with the best tools and models, the reliability of your analysis hinges on accurate assumptions. Solid market research should inform every input - gut feelings or outdated data won’t cut it.
For example, base rental growth and expense projections on current market conditions and adjust them as they evolve. A 3% annual rent growth might make sense in a thriving downtown area but could be overly optimistic for a struggling suburban market. Use recent comparable transactions, consult local property managers, and review market reports from established firms to stay informed.
Don’t overlook operating expenses. Factor in current costs and anticipate increases in insurance, taxes, utilities, and maintenance. A property built in 1985, for instance, will likely have higher maintenance costs than one built in 2015, and your model should reflect that.
When setting cap rate assumptions, rely on recent sales of comparable properties rather than broad market averages. A 6% cap rate might work for a Class A office building but could be far too aggressive for an older retail property. Always compare similar assets to ensure accuracy.
Keep your assumptions up to date - what was accurate six months ago might not hold true today. Establish a routine to review and refresh your key inputs quarterly, or even more frequently during volatile market periods.
Pay special attention to interest rate assumptions, as they can dramatically affect returns. Don’t just rely on current rates; consider future trends and test multiple scenarios to understand potential outcomes. Finally, document your sources and reasoning behind each assumption. This practice not only ensures transparency but also provides a clear reference when presenting your analysis to investors or lenders.
Sensitivity Analysis Methods and Tools Compared
When it comes to assessing risk factors in real estate valuations, picking the right sensitivity analysis method can make all the difference. Each approach offers unique benefits and trade-offs, so understanding the options is crucial.
Analysis Method Comparison
Sensitivity analysis methods vary in complexity and the depth of insight they provide. Here's a quick breakdown:
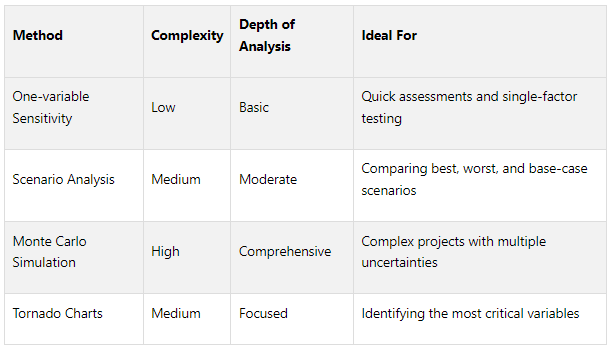
One-variable sensitivity analysis is straightforward and helps you see how individual factors - like interest rates or vacancy rates - affect outcomes. It’s a fast method but can overlook the interplay between variables, even though small changes can significantly alter returns.
Scenario analysis steps it up by examining multiple variables at once. For example, you could model a recession scenario where vacancy rates rise, rents drop, and expenses increase. This allows you to see how a 10% dip in rental income might shave several percentage points off your ROI.
Monte Carlo simulations take a more advanced approach by running thousands of scenarios with different probability distributions. This method is ideal for large, complex projects with many uncertainties, though it demands time and statistical know-how.
Tornado charts are another practical tool, especially for identifying which variables have the biggest impact on returns. For instance, a 1% increase in the cap rate could slash a property’s value by hundreds of thousands of dollars, depending on its net operating income.
Choosing the right method depends on the complexity of your project and the level of detail you need. But the tools you use to conduct the analysis can also play a big role in your efficiency and accuracy.
Manual Methods vs Automated Software
The decision between manual tools like Excel and automated platforms can significantly influence the speed and precision of your analysis. Let’s compare:
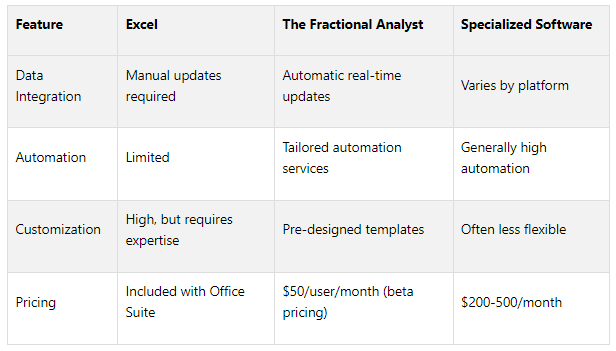
Excel-based analysis offers unparalleled flexibility, making it a favorite for custom models. However, it’s time-intensive and requires advanced skills to maintain complex models and keep data up to date.
Automated platforms, like CoreCast from The Fractional Analyst, simplify the process by integrating real-time market data directly into their models. This eliminates manual data entry, reduces errors, and ensures your analysis reflects the latest market conditions. For example, The Fractional Analyst provides ready-made templates tailored to multifamily acquisitions and mixed-use developments, saving time and improving accuracy.
For professionals juggling multiple deals, automated tools are a game-changer. They cut down on repetitive tasks, maintain consistent standards, and make it easier to present polished data to investors and lenders. While subscription costs can range from $50 to $500 per month, the time and accuracy gains often justify the expense.
Ultimately, your choice between manual and automated methods should align with your workload and goals. For smaller-scale investors analyzing properties occasionally, Excel might suffice. But for developers managing multiple projects, automated platforms can streamline operations and elevate your analysis. By choosing the right method and tool, you not only refine your evaluations but also sharpen your investment strategy by clearly identifying risks and opportunities.
Conclusion: Why Sensitivity Analysis Matters for Real Estate
Sensitivity analysis plays a crucial role in separating profitable investments from potential financial missteps by showing how market changes can impact your returns. Here's a recap of the key takeaways and some practical advice for incorporating this tool into your real estate strategy.
Main Points to Remember
What makes sensitivity analysis so powerful is its ability to uncover risks before they materialize, while also identifying opportunities that others might overlook. Properties that perform well under various scenarios are generally safer bets, whereas deals that only succeed under perfect conditions should raise red flags.
Some variables carry more weight than others. For instance, interest rates, vacancy rates, and operating expenses can greatly influence property values. A rise in interest rates can quickly reduce cash flow and returns, while unexpected increases in operating expenses can cut into net income. Balancing these numbers with a solid understanding of market trends, tenant behavior, and broader economic factors is critical for making informed decisions.
The quality of your data matters. The reliability of your analysis depends on the accuracy of the information you use. Relying on up-to-date market data, realistic assumptions, and cautious estimates can shield you from overly optimistic projections that might not hold up in reality.
Getting Started with Sensitivity Analysis
To put these insights into action, follow these steps to integrate sensitivity analysis into your property evaluations.
Start with simple Excel models to see how changes in rental income, expenses, or financing terms affect metrics like internal rate of return (IRR) and cash-on-cash returns. Develop a checklist of key variables to test for each property - things like rental rates, vacancy assumptions, operating expense ratios, cap rates, and loan terms.
Focus on realistic scenarios. For example, testing a 5% increase in rental income or a 1% rise in interest rates provides more practical insights than extreme changes like a 50% swing in either direction.
For those managing multiple properties or complex projects, tools like The Fractional Analyst's CoreCast can simplify the process. These platforms integrate real-time market data and offer pre-built templates tailored to different property types, cutting down on manual work and reducing errors.
Keep your analysis current. Regularly updating your models ensures your decisions are based on the latest market conditions, not outdated assumptions. Whether you're buying your first rental property or overseeing a large portfolio, sensitivity analysis equips you with the clarity to pursue deals that can weather market shifts - and the caution to avoid those that can't.
FAQs
-
Sensitivity analysis is an essential method for navigating risks in real estate investments, particularly when market conditions are uncertain. It involves evaluating how shifts in key factors - like property values, rental income, or operating costs - can influence the overall success of an investment.
By using this approach, investors can pinpoint areas of vulnerability and explore different scenarios to refine their strategies. This not only leads to smarter decision-making but also helps minimize dependence on unpredictable elements, reducing the likelihood of losses during challenging market periods. In short, sensitivity analysis offers a sharper understanding of the risks and opportunities tied to real estate investments.
-
Traditional sensitivity analysis in real estate typically involves tweaking one variable at a time while leaving all others unchanged. While straightforward, this method can oversimplify complex situations and miss the interplay between different factors, potentially leading to a limited view of both risks and opportunities.
For more nuanced scenarios, Monte Carlo simulations offer a smarter alternative. These techniques account for multiple uncertain variables and their relationships by using probability distributions to simulate a wide range of possible outcomes. This approach provides a deeper and more realistic risk assessment, especially useful for intricate or uncertain property valuations. By embracing these methods, you can make better-informed decisions in ever-changing real estate markets.
-
To make sure your sensitivity analysis assumptions align with the realities of real estate valuations, start with trustworthy market data and a review of historical trends. Bring in perspectives from industry professionals and zero in on critical factors like purchase price, occupancy rates, and operating expenses. Adjust these factors within realistic boundaries to mirror the current market landscape.
Keeping your assumptions current is just as important. Regularly refresh your data by tracking local market trends, monitoring economic indicators, and staying aware of regulatory changes that could influence property performance. With up-to-date information as your foundation, you’ll be in a stronger position to spot both risks and opportunities in your real estate investments.