
5 Steps to Apply Sales Comparison Approach in CRE

If I want a sales comparison value I can defend, I do five things: define the property, verify the sales, pick the right pricing unit, adjust each comp, and then test the result against the market.
This approach works best when I have recent, arm’s-length sales and enough detail to explain every adjustment. In most CRE cases, I’m comparing office, retail, and industrial on $/SF, multifamily on $/unit, and hotels on $/key. If my comp set is old, thin, or full of weak matches, the answer gets less reliable fast.
Here’s the article in plain terms:
- Step 1: Set the assignment, value date, and subject property facts
- Step 2: Screen and verify comps instead of trusting database entries at face value
- Step 3: Use the right unit of comparison and build a clean sales grid
- Step 4: Adjust the comparable, not the subject, for time, location, size, condition, and income differences
- Step 5: Check whether the final number fits how that property type trades in the market
A few points stand out:
- Sales from the last 90 days usually deserve the first look
- Condition adjustments often fall in the 5% to 10% range when supported by market evidence
- In the multifamily example, the adjusted range lands between $139,500/unit and $145,600/unit
- For a 120-unit asset, that points to about $17.1 million
| Step | What I focus on | Main goal |
|---|---|---|
| 1 | Assignment and subject facts | Keep the analysis on track |
| 2 | Recent, verified sales | Remove weak comps early |
| 3 | Pricing unit and sales grid | Keep comparisons consistent |
| 4 | Adjustments and reconciliation | Turn raw sales into a value opinion |
| 5 | Property-type check | Make sure the result fits market behavior |
Bottom line: I don’t get a sound value from more comps. I get it from better comps, clean adjustments, and clear support.
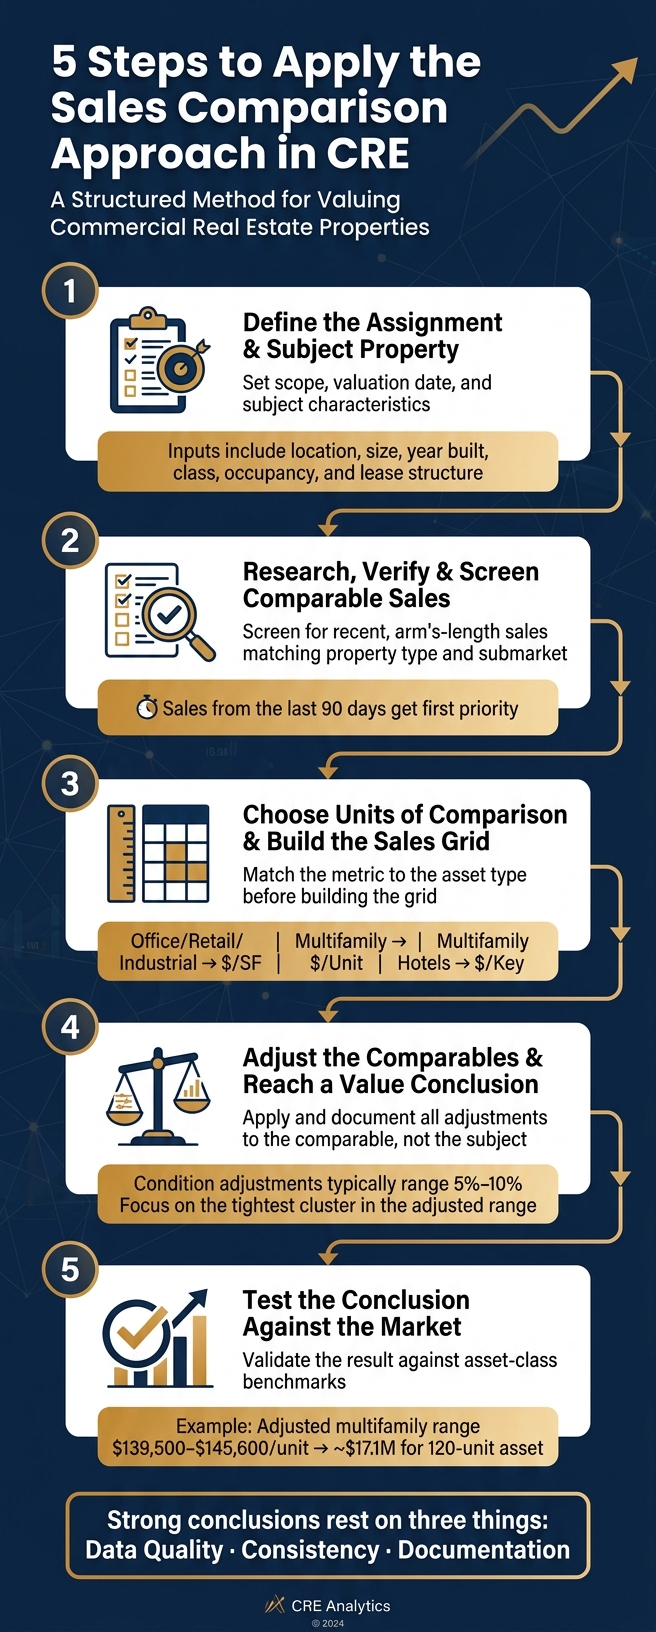
5-Step Sales Comparison Approach for CRE Valuation
Real Estate Exam [National] 26, Sales Comparison Approach Explained
sbb-itb-df8a938
Step 1: Define the Assignment and the Subject Property
Start by defining the assignment and the subject property. If you skip this step, comp selection, unit choice, and adjustments can go off track fast.
Set the scope, date, and intended use
The intended use shapes both the analysis and the reporting standard. An acquisition underwriting assignment calls for something different than lender reporting, a portfolio review, or an internal asset management update.
The effective date of value matters just as much. That’s the exact date your value conclusion applies to. You also need to decide whether the conclusion is as-is or stabilized.
Document the subject property's key characteristics
After the scope is clear, write down the subject property’s core details before looking at any comps. That includes location, building area, site size, year built or renovated, class, occupancy, tenancy, and lease structure.
These are the traits that shape comp selection and adjustments.
| Characteristic | Impact on Comp Selection |
|---|---|
| Location | Must match submarket investment profile |
| Size (SF or acres) | Requires adjustment for economies of scale |
| Property type | Dictates the primary peer group |
| Zoning | Limits comps to those with similar legal use |
| Condition / year built | Older or unrenovated assets need downward adjustments |
These inputs decide which sales count as true comparables.
Use a consistent underwriting framework
Keep property inputs standardized so comp selection, adjustments, and reconciliation stay aligned.
Once the subject is clearly defined, the next step is to verify recent arm's-length sales.
Step 2: Research, Verify, and Screen Comparable Sales
Use the subject profile from Step 1 to build a defensible comp set. In this step, quality beats quantity. The goal is to trim the sale pool fast by leaning on the subject details you already have.
Select sales that match property type and submarket
Start with the basics: asset type, submarket, deal size, vintage, occupancy at sale, and sale date. Put verified sales from the last 90 days at the top of the list. Older sales can still work, but only if you apply documented time adjustments and spell out the market-condition logic behind them. If the market has moved, even a sale from a few months back may need a time adjustment.
Verify Transaction Terms Before Using a Comp
Don’t rely on database data alone. Verify each comp with transaction details from buyers, sellers, or brokers before you use it.
| Transaction Detail | Verification Action | Impact if Unverified |
|---|---|---|
| Sale Price | Cross-check public records vs. broker flyers | Inaccurate baseline for all adjustments |
| Financing | Identify seller-carry or other unusual financing terms | Artificially inflated or deflated sale price |
| Motivation | Interview parties for "fire sale" or 1031 exchange pressure | Inclusion of non-market outlier data |
| Concessions | Review repair credits or free rent periods | Overstatement of the effective net sale price |
| Property Condition | Review date-stamped photos or inspection notes | Failure to account for "as-is" vs. renovated value |
Leave out family transfers, foreclosures, and bulk portfolio sales. They rarely reflect open-market behavior. The same goes for distressed, atypical, or unverified deals. If the transaction doesn’t hold up under review, it doesn’t belong in the comp set.
Build a Clean Comp Set with CoreCast
CoreCast pulls U.S. CRE comp data into one place and flags outlier pricing or missing details before they distort your analysis.
Document every exclusion. Then move to the next step: pick the right unit of comparison and build the sales grid.
Step 3: Choose Units of Comparison and Build the Sales Grid
Using the verified comps from Step 2, pick the unit of comparison before you build the sales grid. That unit needs to fit the asset type and give you a solid basis for adjustments. In CoreCast, use the same comparison fields for every sale so the grid stays consistent.
Match the metric to the asset type
Office, retail, and industrial assets are usually compared on price per square foot. Multifamily is most often compared on price per unit, with price per square foot and cap rate used as secondary checks. Hotels are commonly compared on price per key, with RevPAR and ADR as secondary checks.
For stabilized assets, it also helps to include an implied cap rate as a secondary check. If that number looks out of line with market cap rates, go back and review the comp before you move ahead.
| Asset Type | Primary Unit | Secondary Check | Key Elements of Comparison |
|---|---|---|---|
| Office | Price per SF | Implied Cap Rate / WALT | Floor plate size, parking ratio, tenant credit, Class (A/B/C) |
| Retail | Price per SF | Implied Cap Rate | Visibility, traffic counts, anchor tenant credit, lease structure |
| Industrial | Price per SF | Implied Cap Rate | Clear height, loading docks, power supply, truck court depth |
| Multifamily | Price per Unit | Price per SF / Cap Rate | Unit mix, utility metering, amenities, renovation level |
| Hospitality | Price per Key | RevPAR / ADR | Brand/flag, F&B facilities, meeting space, PIP requirements |
Once you lock in the unit, the sales grid makes it easier to see which differences will drive adjustments.
List the elements of comparison in a sales grid
The grid turns verified comps into a format you can adjust. It should line up each comp against the subject before any adjustments are made. At this stage, the goal is to show the differences, not solve them.
The grid should cover the value drivers for each property type, including location, physical traits, tenancy, and transaction terms. Keep the layout the same across comps so the comparison is easy to read and support.
| Comparison Factor | Office | Retail | Industrial | Multifamily | Hospitality |
|---|---|---|---|---|---|
| Location | Submarket/CBD | Visibility/Traffic | Highway Access | School District | Proximity to Demand |
| Physical | Floor plate size, parking ratio, Class (A/B/C) | Anchor tenant credit, storefront quality | Clear height, loading docks, power supply | Unit mix, amenities | Brand/flag, F&B facilities, meeting space |
| Tenancy | Tenant credit, lease terms, WALT | Lease structure, NNN vs. gross | Single vs. multi | Occupancy % | ADR/RevPAR |
| Transaction Terms | Concessions | TI allowances | Sale-leaseback | Financing | Management contract |
A clear grid makes Step 4 adjustments faster and much easier to support.
Step 4: Adjust the Comparables and Reach a Value Conclusion
Use the Step 3 grid to turn each difference into a dollar or percentage adjustment. Then bring those adjusted values together into one defensible value conclusion.
Apply quantitative and qualitative adjustments
Start with the differences you flagged in the sales grid. From there, convert each one into an adjustment.
Adjustments are always made to the comparable, not to the subject. If the subject is better, adjust the comp upward. If the subject is worse, adjust it downward. The point is simple: make each comp look as close to the subject as possible before you compare prices.
Use dollar or percentage adjustments for items like timing, location, size, and condition. Use qualitative rankings when the market doesn’t support a precise figure. And don’t rely on gut feel alone. The adjustment should be backed by market data.
| Adjustment Category | Typical Property Types | Adjustment Type | Documentation Needed |
|---|---|---|---|
| Market Conditions | All | Percentage (time/market index) | Paired sales, market indices |
| Location/Submarket | Retail, Office | Percentage or qualitative | Traffic counts, demographic data |
| Size (SF/Units) | Office, Industrial, Retail, Multifamily | $/SF or $/Unit | Tax records, survey documents |
| Condition/Age | All | Percentage (5%–10%) | Property Condition Report, inspections |
| Lease Structure | Office, Retail, Industrial | Qualitative or income-based adjustment | Rent rolls, lease abstracts, WALT calculations |
| Occupancy/Tenancy | Multifamily, Hotel, Office | Percentage or income-based ($) | Historical operating statements, rent rolls |
| Physical Features | Industrial, Retail | Lump sum ($) or qualitative | Building plans, physical verification |
| Tenant Credit | Office, Retail, Industrial | Qualitative ranking | Credit ratings, financial statement review |
If the adjustments start doing too much of the heavy lifting, that’s usually a warning sign. In plain English, the comp may be too far from the subject to use with much confidence.
After you adjust each comp, line up the results and focus on the tightest cluster. That’s often where the market is speaking most clearly.
Reconcile the adjusted range into a final value
Bring the range down to one conclusion. Don’t just average the comps and call it done.
Give more weight to the comps that are closest to the subject. Watch for the tightest cluster in the adjusted range, because that usually shows where the market is trading. Downweight or remove outliers. If a sale is a clear outlier, say so and explain why it got less weight or was left out.
For office, retail, and industrial, cross-check the concluded value against the implied cap rate to make sure the reconciliation still makes sense. For multifamily, check that both price per unit and price per SF fall within the market range.
Documentation standards and common errors
Once you’ve reconciled the range, document the logic behind every adjustment and every weighting decision.
Each adjustment needs a written reason, not just a number sitting in a spreadsheet cell. Note the data source, explain the logic behind the adjustment, and spell out why some comps carried more weight than others. That’s what makes the conclusion defensible for lenders, investors, and partners who weren’t in the room when the work was done.
The mistakes here are pretty common:
- Over-adjusting, which often means the comp was never that comparable in the first place
- Using stale sales without a time adjustment
- Relying on transactions that were not arm's-length
Step 5: Test the Conclusion with Property-Type Examples
These examples help you check whether the Step 4 changes lead to conclusions that fit the market for each property type.
Office, Industrial, and Retail Example
These examples use the Step 3 units.
With office assets, value often comes down to tenant credit, WALT, parking ratio, and floor plate efficiency. Longer lease terms tend to support stronger pricing and a lower cap rate.
With industrial assets, value leans more on clear height, dock count, truck court depth, power, and transportation access. In practice, better building specs can matter more than a similar lease profile.
With retail assets, value depends on visibility, traffic, corner exposure, signage, and anchor strength. Inline space and anchor space are not the same thing, even if the rent roll looks close on paper.
Multifamily and Hotel Example
Multifamily and hotels use different units, but the same comp logic still holds.
For multifamily, start with price per unit. Then test that figure against occupancy, unit mix, and renovation status. If you see a meaningful rent gap between the subject and the comps, that often points to value-add potential through renovations [1].
| Element of Comparison | Subject Property | Comp 1 (Superior) | Comp 2 (Inferior) |
|---|---|---|---|
| Sale Price | - | $150,000/unit | $130,000/unit |
| Market Conditions | Current | 0% (Recent) | +2% (Older sale) |
| Location | Prime | -5% (Better corner) | 0% (Similar) |
| Condition/Age | Renovated | 0% (Renovated) | +10% (Unrenovated) |
| Occupancy | 95% | -2% (100% Occ.) | 0% (94% Occ.) |
| Net Adjustment | - | -7% | +12% |
| Adjusted Value | $142,500/unit | $139,500/unit | $145,600/unit |
That puts the adjusted range at $139,500 to $145,600 per unit, with a midpoint near $142,500. For a 120-unit asset, that's about $17.1 million.
For hotels, switch to price per key and look closely at ADR, RevPAR, brand flag, renovation status, and occupancy stability. Recent capital improvements and steadier operations usually mean fewer adjustment issues.
Conclusion: The Five-Step Process at a Glance
A reliable sales comparison conclusion comes from doing the work in the right order. The five-step process is straightforward: define the assignment, verify the comps, choose the right unit, adjust and reconcile, then test the result.
Strong conclusions rest on three things: data quality, consistency, and documentation. That means documenting every excluded sale, every adjustment, and every data source.
Tools can speed up the research. Judgment is what sets value.
Use this quick checklist to review the full process.
| Step | Core Action | Key Principle |
|---|---|---|
| Define Assignment | Set scope, valuation date, and subject characteristics | Clarity before analysis |
| Research & Verify Comps | Screen for recent, verified arm's-length sales that match the property type and submarket | Recent data beats more data |
| Choose Comparison Units | Match the metric to the asset type - price per SF, price per unit, or price per key | Consistency across the grid |
| Adjust & Reconcile | Apply and document all adjustments | Defensible, not just directional |
| Test the Conclusion | Validate the result against specific asset-class benchmarks | Market fit is the final check |
Done right, this process gives you a value opinion you can stand behind.
FAQs
When is the sales comparison approach most reliable in CRE?
The sales comparison approach tends to be most reliable when you have recent, verified sales of similar properties in the same market.
It usually works best in stable markets when the data comes from the past 6 to 12 months. In faster-changing markets, a 3 to 6 month window is often a better fit.
Its accuracy comes down to the quality of the data. You need comparable open-market sales between willing parties, along with physical and location traits that closely match the subject property. If the comparables are off, the value estimate can drift too.
How many adjustments are too many for a comparable sale?
There’s no fixed cap on the number of adjustments or the dollar amount of those adjustments. What matters is support. Each adjustment needs to be backed by objective market evidence and needs to match the way the market reacts to differences between properties.
To improve accuracy and cut down on large adjustments, analysts should focus on choosing three to six comparables that are the closest match to the subject property.
What should I do if I can’t find enough recent arm’s-length comps?
First, widen your search a bit. Look at properties that are a little farther away, as long as they still line up closely with your subject property in size, layout, and condition.
If you need to use older comps, make adjustments for market changes since the sale date. And when you're dealing with a one-of-a-kind or specialized property with thin market data, the replacement cost approach can be a solid backup.