Scenario Analysis Frameworks for CRE Investments
Scenario analysis helps commercial real estate (CRE) investors navigate uncertainties by modeling potential outcomes under different conditions. Instead of relying on a single prediction, it evaluates how market changes - like interest rates, rental income, or property values - impact returns. Here's why it matters and the key methods to use:
Why it’s important: CRE investments are sensitive to market shifts. For example, a 1% rise in interest rates can reduce property values by up to 10%. Scenario analysis helps manage risks, optimize resources, and plan for the unexpected.
Key methods:
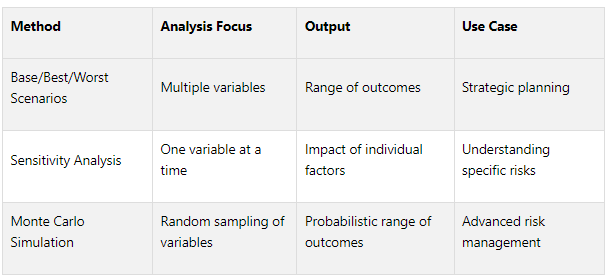
Base/Best/Worst Case Scenarios: Model likely, optimistic, and adverse outcomes.
Sensitivity Analysis: Focus on how changes in a single variable (e.g., interest rates) affect performance.
Monte Carlo Simulation: Generate thousands of potential outcomes to account for variability in market factors.
Tools to use: Excel models are a great starting point, but platforms like CoreCast and expert services like The Fractional Analyst enhance accuracy and insights.
Quick Comparison of Methods
Sensitivity analysis with 2 input variables in real estate
Core Scenario Analysis Frameworks for CRE
Building on the foundational ideas we've covered, these frameworks sharpen your approach to scenario planning in commercial real estate (CRE). Let’s dive into three key methods that can guide precise investment decisions.
Base, Best, and Worst Case Scenarios
This classic three-scenario approach is the backbone of most CRE investment analyses. It provides a well-rounded view of potential outcomes by modeling likely, optimistic, and adverse conditions.
Base Case Scenario: This is the most realistic outcome, grounded in current market conditions and reasonable assumptions. It factors in existing data like property values, rental rates, occupancy levels, and economic trends, assuming stable growth in rental income and steady operating costs.
Best Case Scenario: This scenario imagines a favorable market environment, where property values and rental income rise due to positive trends. It helps investors visualize maximum potential returns and uncover opportunities for growth.
Worst Case Scenario: Here, you consider the harshest conditions, such as economic downturns or unfavorable regulatory changes. This model prepares investors for reduced property values and income, helping them craft contingency plans.
For instance, a CRE firm planning a project in a bustling urban area might use the best-case scenario to predict stronger rental yields in a thriving economy, while the worst-case scenario accounts for possible market declines.
Sensitivity Analysis
Sensitivity analysis zeroes in on how individual changes in key variables impact investment performance. By isolating one factor at a time, it highlights the ripple effects of shifts in interest rates, property prices, rental income, operating costs, or cap rates.
Take interest rates as an example: if the rate rises from 5% to 6%, annual mortgage payments might jump from $40,000 to $48,000, cutting cash flow to $22,000 and lowering ROI to 11%. On the flip side, a drop to 4% could reduce payments to $32,000, boosting cash flow to $38,000 and ROI to 19%. Similarly, a 10% dip in rental income (from $100,000 to $90,000) could shrink net operating income (NOI) to $60,000, cash flow to $20,000, and ROI to 10%. A 10% increase (to $110,000) might instead raise NOI to $80,000, cash flow to $40,000, and ROI to 20%. These examples show how even small changes can significantly affect returns.
Monte Carlo Simulation
Monte Carlo simulation (MCS) takes scenario analysis to the next level. This statistical method uses random sampling to generate thousands of potential outcomes, offering a detailed view of risks and opportunities. Unlike traditional approaches that focus on a few scenarios, MCS incorporates the variability of factors like rental growth, occupancy rates, and cap rates.
Research from MIT highlights the power of this approach. One study found that a simple MCS model could produce an Expected Net Present Value (ENPV) over $500,000 higher than a static discounted cash flow (DCF) model, even with the same average growth rate [3]. A more dynamic MCS model, factoring in elements like occupancy growth and exit cap rates, revealed a wider risk range - a standard deviation of $2.6 million versus $1.5 million for a simpler model, a 44% difference [3]. This illustrates the "Flaw of Averages", where relying on average inputs can obscure the true range of outcomes.
“Monte Carlo simulations offer a robust tool for CRE investors to assess risk by accounting for the inherent variability in market factors like vacancy rates. This method provides a probabilistic range of outcomes rather than a single deterministic forecast, enabling better risk management and decision-making.”
“The Monte Carlo simulation provides multiple possible outcomes and the probability of each from a large pool of random data samples – thus, it offers a clearer picture than a deterministic forecast.”
To make the most of Monte Carlo simulation, CRE professionals must accurately define probability distributions based on historical data and expert insights. Applying this technique to variables like occupancy, expenses, and cap rates enhances both risk evaluation and decision-making.
These three methods - base/best/worst case scenarios, sensitivity analysis, and Monte Carlo simulation - equip CRE investors with tools to analyze risk and make informed decisions. Up next, we’ll explore how to bring these frameworks to life using Excel models tailored for CRE analysis.
Building Scenario Analysis Models in Excel for CRE

Now that we've covered the foundational frameworks, it's time to roll up your sleeves and build practical Excel models for scenario analysis. These models are crucial for making sound investment decisions in commercial real estate (CRE), as they help assess risks and explore a range of potential outcomes. By carefully planning, designing, and validating your models, you'll create tools that can guide you through complex market conditions.
Selecting Key Inputs and Assumptions
The effectiveness of your scenario analysis model hinges on selecting the right inputs and assumptions. Think of this step as the backbone of your model - its accuracy depends entirely on the quality of the data you use.
Start with current market conditions. Use property values, rental rates, and occupancy levels as your baseline. Then, layer in broader economic indicators like GDP growth, employment rates, inflation, and consumer confidence. These factors set the stage for understanding how your property might perform under different scenarios [1].
Pay special attention to interest rates, as they play a significant role in CRE investments. For example, research suggests that a 1% increase in interest rates can reduce property prices by up to 10% [2]. To account for this, include current rates, projected changes, and stress-test scenarios that reflect potential shifts in Federal Reserve policies.
Don’t overlook regulatory factors like property laws, zoning rules, and tax policies. For instance, recent changes in local tax assessments or pending zoning updates should be reflected in your assumptions.
Lastly, incorporate operational factors such as maintenance costs, management fees, and tenant turnover rates. Historical data from comparable properties can help you set realistic benchmarks for these variables.
Creating Scenario Matrices and Outputs
A well-structured scenario matrix is the heart of your model. It connects your inputs to meaningful financial outputs, making it easy to toggle between different scenarios while maintaining accuracy.
Use a dedicated assumptions tab to centralize key inputs. Excel's OFFSET function is particularly useful for creating dynamic models that let you switch between scenarios like "Strong case", "Base case", and "Weak case" with minimal effort [5][6].
Your output matrices should focus on key CRE metrics such as Internal Rate of Return (IRR), cash-on-cash returns, equity multiples, and Net Present Value (NPV). Organize these outputs into summary tables to allow for quick comparisons across scenarios.
Adding a dashboard can make your model even more user-friendly. Summarize key metrics, performance indicators, and valuation highlights using charts and graphs. Visual representations make it easier to spot trends and identify which variables have the greatest impact on returns [5].
Once your matrices and outputs are set, shift your focus to designing a model that's both reliable and easy to use.
Model Design and Validation Best Practices
Building a strong Excel model requires sticking to design principles that emphasize accuracy, clarity, and ease of use.
Keep it simple and clear. Corey Philip, owner of Wisdify, puts it best:
“The key to all best practices is their simplicity, clarity, accuracy, and efficiency. By focusing on these qualities, the model will provide investors with a reliable framework ensuring sound decision-making.”
Separate inputs from outputs throughout your model. Dedicate one section to assumptions and historical data, while keeping calculations and results in another. This structure not only reduces errors but also makes updates straightforward [8].
Use data validation to ensure inputs stay within acceptable ranges. For example, restrict occupancy rates to values between 0% and 100%, or set cap rates to align with typical market norms. Conditional formatting can flag cells with unexpected values, helping you catch errors early [10]. Include checks for balance sheet accuracy, cash flow consistency, and financial ratios to ensure your model aligns with industry standards [5].
Document your assumptions on a separate sheet. Record data sources, calculation methods, and the reasoning behind key inputs. This documentation is invaluable when presenting your model to investors or revisiting it later for updates [7].
Protect critical areas of your model by locking cells or worksheets containing formulas. This prevents accidental changes that could compromise your analysis [10].
Finally, stress-test your model with extreme scenarios. For example, simulate what happens if occupancy drops to zero, interest rates spike, or rental income plummets. If your model fails under these conditions, refine it until the outputs remain realistic [9].
Regular updates and reviews are essential to keep your model relevant. Real estate markets can change rapidly, so assumptions that were valid six months ago may no longer apply. Schedule periodic reviews to refresh key inputs and compare your model's projections against actual market performance [7].
Transform Your Real Estate Strategy
Access expert financial analysis, custom models, and tailored insights to drive your commercial real estate success. Simplify decision-making with our flexible, scalable solutions.
Reading Scenario Outputs for Risk Assessment
Once your Excel model is validated, the next step is to interpret its outputs to guide your investment decisions. By following the structured framework within Excel, these analyses can help you understand the risk profile of your investment. Data becomes meaningful when it highlights potential risks, uncovers opportunities, and assesses how resilient your investment might be.
Reading Outcome Ranges
The gap between the best-case and worst-case scenarios reveals the uncertainty surrounding your investment's returns. For example, analyzing the spread of the Internal Rate of Return (IRR) can show how sensitive your returns are to market conditions. If your base case projects a 12% IRR but the other scenarios vary widely, it signals substantial market sensitivity. For reference, IRR metrics often range between 10% and 20%, depending on the property type and market environment [13].
Pay close attention to cash flow variability across scenarios. While total returns are important, annual cash flow projections can help identify periods where additional reserves might be required.
For investments involving debt, the Debt Service Coverage Ratio (DSCR) is a critical metric. Most A and B lenders expect a DSCR between 1.25 and 1.5 [13]. If your worst-case scenario pushes the DSCR below 1.0, the risk of loan default rises significantly. Stress-testing this ratio under downside scenarios can provide insight into how well your investment can weather financial challenges [11].
Exit yield sensitivity is another key consideration. Analyzing how changes in market cap rates might affect your final sale proceeds is essential, as even small shifts in cap rates can have a pronounced impact on overall returns [11].
These quantitative evaluations help you pinpoint potential vulnerabilities, which are explored in greater detail below.
Spotting Downside Risks
Worst-case scenarios act as an early warning system, highlighting vulnerabilities before they escalate. One major area to monitor is cash flow interruptions. Rental income could drop due to tenant departures, economic slowdowns, or an oversupply in the market. If your property relies heavily on one or two tenants, losing a major tenant could cause significant cash flow issues.
Unexpected spikes in operating expenses, such as property taxes, utility costs, or major repairs, can also catch investors off guard. Your worst-case scenario should account for these possibilities, aiming to keep the Operating Expense Ratio below 80% even in tough conditions [12].
Interest rate sensitivity is another factor to consider, particularly for variable-rate loans or refinancing scenarios. Evaluating how interest rate changes might affect your returns can help you prepare for fluctuations in the financial landscape.
Market timing risks can be assessed by modeling different exit timing assumptions. Having flexibility in your exit strategy can allow you to hold the property longer if it improves overall returns.
Lastly, tenant concentration and lease expiry profiles deserve close attention [11]. A large number of lease expirations within a short time frame could increase the risk of vacancies and reduced rental income.
Summarizing these risk factors in tables can make your analysis clearer and easier to communicate.
Creating Tables to Compare Scenarios
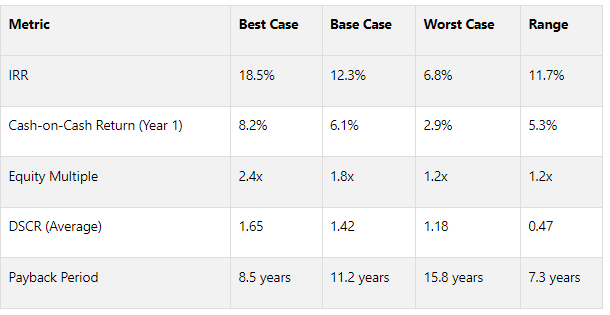
Using well-organized tables to compare scenarios can make patterns and risks more apparent. Tables help translate complex data into actionable insights that are easier to share with stakeholders.
Here’s an example of a summary metrics table comparing key performance indicators across scenarios:
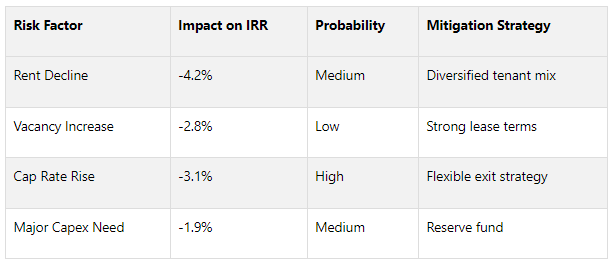
A risk factor impact table can also provide valuable insights by showing how various variables might affect returns and suggesting mitigation strategies:
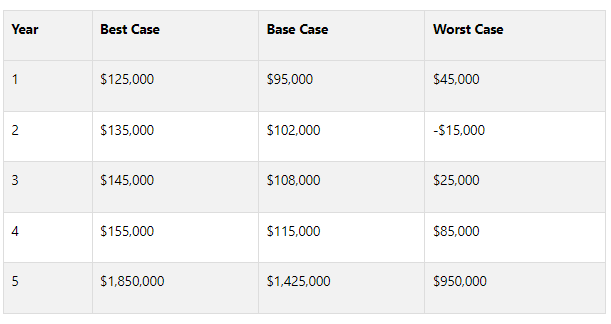
A cash flow timing table can further reveal when your investment might face stress by outlining annual cash flows across scenarios:
Improving Scenario Analysis with The Fractional Analyst and CoreCast

While Excel-based models are a great starting point for scenario analysis, more advanced tools and expert input can take your evaluations to the next level. The Fractional Analyst combines the expertise of seasoned financial analysts with the self-service capabilities of the CoreCast platform, offering a flexible and powerful way to handle complex commercial real estate (CRE) scenarios. Together, these services extend the foundational framework of scenario analysis, delivering deeper insights and greater accuracy.
Direct Servicing for Tailored Analysis
Turning basic spreadsheets into powerful investment tools requires expert input. The Fractional Analyst brings a team of experienced professionals who specialize in crafting custom analyses tailored to the unique challenges of CRE transactions. As The Fractional Analyst notes, "No single model can fit every deal." This is especially true for deals involving mixed-use properties, unconventional financing, or complicated structures.
Their direct servicing approach includes support for underwriting, helping to align scenario assumptions with current market trends. Analysts also refine scenarios with real property performance data, create polished pitch decks for investor presentations, and provide localized market research. Whether you're working on best-case, base-case, or worst-case scenarios, these services ensure your models are realistic, defensible, and ready for decision-making.
Self-Servicing with the CoreCast Platform
For professionals who prefer a hands-on approach, the CoreCast platform offers an all-in-one real estate intelligence solution. CoreCast consolidates tools and data into a single platform, enabling smarter investment strategies and more efficient operations [14]. Unlike static Excel models, CoreCast allows users to view related data alongside forecasts and see updates in real time [14].
By centralizing assets, projects, and financial data [14], CoreCast turns complex reports into clear, actionable insights [15]. The platform makes it easy to generate custom portfolio summaries [14], track KPIs through real-time dashboards, and automate quarterly reporting [15]. Designed for investors, lenders, and asset managers, CoreCast supports ongoing scenario monitoring, simplifying workflows while enhancing decision-making.
Free Financial Models and Tools
To complement these advanced tools and services, The Fractional Analyst also provides free downloadable Excel models. Once sold for $1,000 to $3,000 each [16], these models are now available at no cost, offering a strong starting point for scenario analysis in CRE.
One standout is the Multifamily Acquisitions Model, which comes pre-loaded with assumptions, error-checking features, and sensitivity tables. This model is particularly useful for analyzing scenarios involving rent growth, exit cap rates, and lease-up timelines. Considering that an estimated 90% of spreadsheets contain errors [17], these professionally built models - complete with built-in validation - can significantly enhance the reliability of your analysis. They’re designed to handle complex strategies such as value-add multifamily investments and mixed-use developments, saving you the hassle of building everything from scratch.
Institutional acquisitions teams use these models to streamline analysis for portfolios worth $50 million or more [16]. Meanwhile, boutique firms, private equity funds, and development teams rely on them for investor-ready outputs, detailed cost breakdowns, and consistent modeling across teams. While these free models provide a solid foundation, they often require customization to address the unique aspects of each investment. Paired with expert analysis and the CoreCast platform, this ecosystem equips CRE professionals with the tools and insights needed for precise and flexible scenario analysis. Together, these resources ensure that your CRE investments are evaluated with confidence and clarity.
Key Takeaways for CRE Scenario Analysis
Scenario analysis takes commercial real estate (CRE) investing from a realm of uncertainty to one of strategic foresight. By systematically exploring a range of potential outcomes, investors can better navigate market shifts and build portfolios that remain resilient across various economic landscapes. Let’s break down the key advantages and practical applications of scenario analysis in CRE investing.
How Scenario Analysis Enhances CRE Decision-Making
Scenario analysis equips investors to handle multiple potential futures rather than banking on a single outcome. By accounting for everything from economic downturns to interest rate changes, this approach allows for a broader, more inclusive view of market possibilities [18].
This method helps investors model complex market dynamics and prepare for shifts before they happen. By doing so, they can identify risks early and develop strategies to address them proactively [1][2]. The result? Smarter, more confident decisions rooted in a comprehensive understanding of best-case, worst-case, and most probable scenarios.
Stress testing, a critical element of scenario analysis, evaluates how investments might perform under extreme market conditions. This not only highlights vulnerabilities but also strengthens portfolios by addressing potential weaknesses [1].
Leveraging Tools and Expert Insights
While Excel-based models are a great starting point for scenario analysis, combining them with advanced tools and expert advice takes things to the next level. Successful integration of scenario analysis into a broader investment strategy requires both the right technology and seasoned expertise to guide decisions at every stage - from asset selection to risk management [1].
Keeping scenarios relevant means continuously monitoring and updating them as market conditions evolve [1]. This demands tools that can adapt to new data and trends quickly. Platforms like CoreCast, paired with expert insights from services like The Fractional Analyst, provide a robust framework for managing dynamic scenarios.
The process begins with establishing baseline assumptions based on current market conditions. From there, realistic scenarios are developed by blending quantitative data with qualitative insights [1]. This involves analyzing economic indicators - like GDP growth, employment rates, and inflation - while leveraging historical data to anticipate future market cycles.
Regular updates ensure that your scenarios remain actionable as conditions change [1][2]. With the support of professional tools and expert guidance, scenario analysis evolves from a one-time task into a continuous strategic advantage. This approach not only strengthens decision-making but also positions investors for long-term success in CRE. It’s a reminder of how ongoing analysis and expert support can transform uncertainty into opportunity.
FAQs
-
Monte Carlo simulation (MCS) takes a different approach compared to traditional scenario analysis by running numerous random simulations to produce a probability distribution of possible outcomes. This method does a better job of reflecting market uncertainty and variability, giving a more dynamic picture of the risks and opportunities in commercial real estate (CRE).
In contrast, traditional scenario analysis relies on a handful of predefined scenarios, like best-case, worst-case, and base-case conditions. While helpful, it falls short of capturing the full spectrum of possibilities or the likelihood of each outcome. MCS offers a more detailed way to assess risks in CRE investments, making it especially useful when market conditions are unpredictable.
-
When creating scenario analysis models for commercial real estate (CRE), it's crucial to zero in on the key variables that can heavily influence investment outcomes. These often include factors like rental rates, occupancy levels, operating expenses, and interest rates. By focusing on these critical inputs, your model will better capture the main drivers of performance.
Developing multiple scenarios - such as best-case, worst-case, and base-case - is a smart way to assess both risks and opportunities. To make these scenarios meaningful, base your assumptions on reliable data, ensure they align with current market conditions, and keep them grounded in reality. This not only enhances the accuracy of your analysis but also instills greater confidence in your investment decisions.
Finally, connect your assumptions directly to financial metrics and design your model to be adaptable. A flexible model allows you to quickly adjust to changes in market conditions or project specifics, making your analysis more dynamic and actionable.
-
Scenario analysis gives commercial real estate (CRE) investors a way to examine how various market conditions - like fluctuating interest rates, economic slowdowns, or changes in property demand - might affect their investments. By simulating different scenarios, investors can pinpoint potential weaknesses in their portfolios and prepare for challenging situations.
This method enables investors to craft strategies to reduce risks. These might include diversifying their holdings, revising financing arrangements, or prioritizing properties with consistent cash flow. By taking a proactive approach to potential market shifts, CRE investors can make smarter decisions and safeguard their investments against unexpected changes.