
Checklist for Advanced DCF Modeling

Want to master Discounted Cash Flow (DCF) modeling for real estate? Here’s what you need to know:
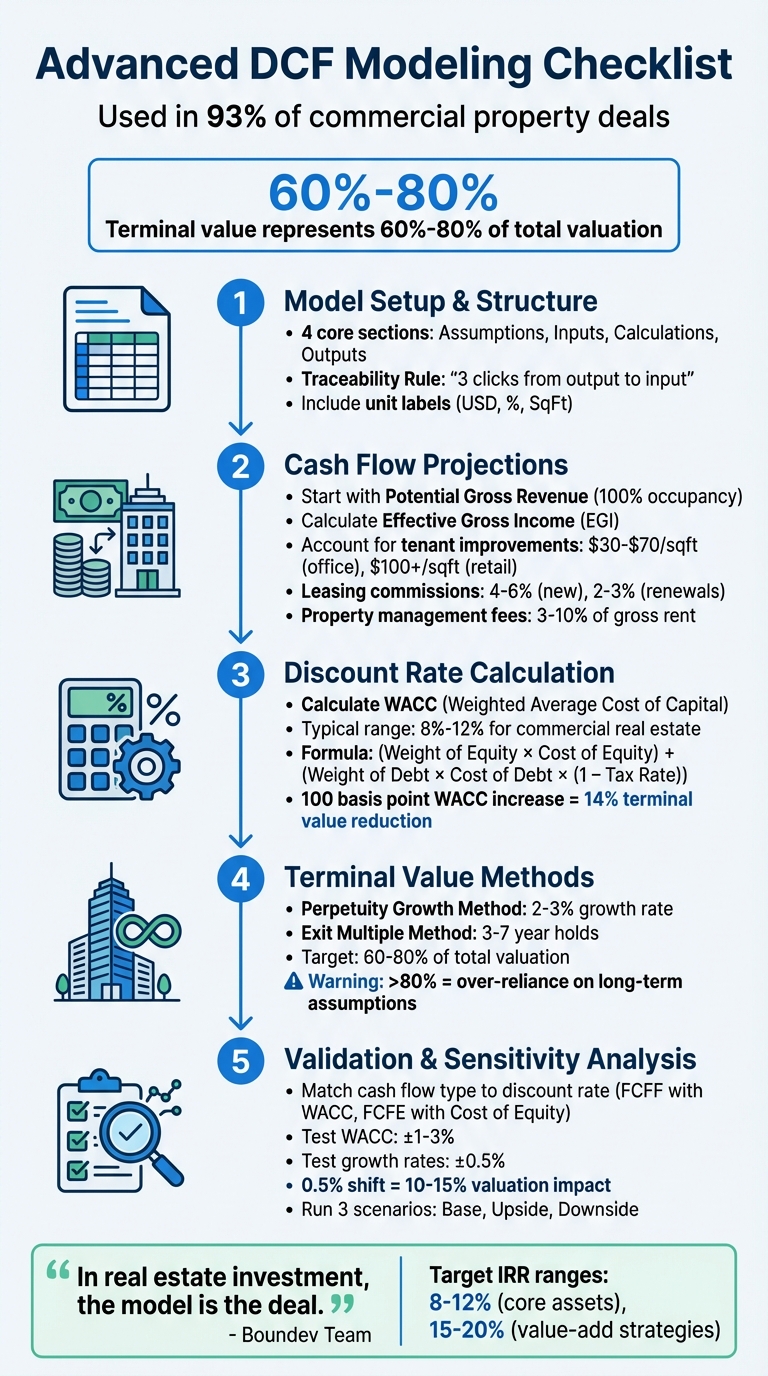
- DCF modeling is used in 93% of commercial property deals to evaluate investment potential by converting future cash flows into present value.
- Advanced DCF models go beyond basics, incorporating tenant details, lease clauses, and renewal probabilities, while stress-testing assumptions like vacancy rates and interest changes.
- This checklist focuses on 5 areas to ensure accuracy: model setup, cash flow projections, discount rate calculations, terminal value methods, and sensitivity analysis.
Key Takeaways:
- Structure your model with clear tabs for assumptions, inputs, calculations, and outputs.
- Account for tenant-level details like rent rolls, lease renewals, and reimbursements.
- Normalize final-year cash flows to avoid skewed terminal values.
- Validate assumptions using sensitivity and scenario analysis.
- Terminal value often represents 60%-80% of total valuation - ensure it’s reasonable.
This guide breaks down these steps to help you build reliable, audit-ready models.
5-Step Advanced DCF Modeling Checklist for Real Estate Investment
Discounted Cash Flow Analysis (DCF) in Real Estate Explained
sbb-itb-df8a938
Model Setup and Structure
Building a dependable DCF model for complex real estate deals involves dividing it into four key sections: Assumptions, Inputs, Calculations, and Outputs. Assumptions include strategic drivers like exit cap rates and rent growth. Inputs rely on raw data, such as rent rolls. Calculations involve modular schedules for items like debt amortization and CapEx reserves. Finally, Outputs summarize key metrics like IRR, NPV, and equity multiples [3]. This modular setup ensures formulas remain intact when assumptions shift and makes auditing much easier.
A critical principle for clarity is the Traceability Rule, as outlined by dcfmodeling.com: “Structure models so an outsider can trace any output back to a single input in three clicks” [3]. This means avoiding overly complex formulas that pull data from multiple tabs. For models exceeding 15 sheets, create a navigation page linking major sections [4]. Additionally, each tab should include a "how to read this sheet" comment box to help external reviewers follow the calculation flow [3]. These guidelines form the foundation for creating an organized and user-friendly workbook.
Organize Tabs and Structure
Tabs should be arranged to clearly separate inputs, calculations, and outputs. Include unit labels (like USD, %, or SqFt) in all headers to avoid confusion or unit mismatches [3]. For example, a 100-basis-point increase in WACC can reduce terminal value by about 14% [3]. Keep all assumptions centralized in one tab, allowing you to test scenarios without breaking formulas across the workbook [4].
Define Forecast and Terminal Periods
Your model should account for multiple hold periods - such as 3, 5, and 10 years - to evaluate how returns vary across scenarios [4]. Since the terminal value can make up 60% to 80% of the total valuation, it’s a crucial calculation [5]. When using the perpetuity growth method, keep the long-term growth rate (g) between 2-3%, aligning it with inflation or GDP growth [5]. Normalize the final year’s cash flows to avoid irregular events skewing the terminal value [3].
Include Commercial Real Estate Schedules
A well-structured model should include a detailed rent roll schedule. This tracks unit types, rents, lease durations, and occupancy levels to calculate Gross Potential Revenue [4][1]. Beyond the basics, advanced models should incorporate lease clauses for expense reimbursements and renewal probabilities [2]. Separate schedules should also cover:
- Revenue streams (e.g., parking and laundry income)
- Operating expenses (e.g., property taxes, insurance, utilities, management fees)
- Debt structures (e.g., LTV ratio, interest rate, amortization terms)
- Returns analysis (e.g., discount rate, exit cap rate) [1]
All variables should be linked back to the centralized Assumptions tab to maintain flexibility and consistency [4].
Once this structure is in place, the next step will focus on cash flow projections and evaluating discount rates.
Cash Flow Projections
To build a reliable cash flow projection, start with a structured, detailed approach. Begin by modeling cash flows from the ground up. Calculate Potential Gross Revenue by assuming 100% occupancy at market rates. From this, subtract allowances for absorption, concessions, and vacancy to determine Effective Gross Income (EGI) [6][7]. For properties with triple-net or modified gross leases, include reimbursements for property taxes, insurance, and maintenance as additional income. These reimbursements can make up a notable portion of revenue, especially for office and retail properties [6][7].
Model Property-Level Details
For more complex deals, a detailed rent roll is essential. This should outline lease expiration dates, renewal options, and rent escalation schedules for key tenants [6][4]. When modeling lease rollovers, use realistic downtime assumptions (typically 3–12 months) and assign renewal probabilities to avoid inflating revenue projections [6]. As James Jenco, Partner at Wiss, explains:
"The pro forma should include detailed assumptions on renewal probability, replacement-market rents, downtime periods, and tenant improvement costs. Otherwise, you're projecting science fiction." - James Jenco, Partner, Advisory, Wiss [6]
Account for tenant improvements (TIs), leasing commissions (LCs), and capital expenditures (CapEx) below the Net Operating Income (NOI) line. For example, office TIs often range between $30–$70 per square foot, while retail TIs can go as high as $100+ per square foot [6]. Leasing commissions typically range from 4% to 6% of the total lease value for new leases and 2% to 3% for renewals [6][7]. To manage irregular costs, establish annual capital reserve allocations. Although brokers may suggest reserves of $0.30 per square foot, actual costs for major repairs like roof or HVAC replacements are often higher [6].
Set Reinvestment and Growth Assumptions
Variable expenses, such as property management fees (3% to 10% of gross rent) and maintenance costs (5% to 10% of gross rent), should increase in line with inflation, typically estimated at 3% to 7% annually [8]. Be aware that property insurance costs have surged by 30% to 50% in many markets over the past three years. Additionally, property tax reassessments following acquisitions often lead to increases of 20% to 40% as assessed values adjust to sale prices [6]. By the final forecast year, CapEx should exceed Depreciation & Amortization to ensure reinvestment supports growth and remains sustainable through the terminal period [8]. Confirm that cash flows in the final year align seamlessly with the assumptions for the terminal period.
Normalize Final Year Cash Flows
Adjust the final year's NOI so its growth rate, typically 2–3%, reflects a stable market. This ensures the explicit forecast period is long enough to avoid abrupt shifts. Sudden drops in growth rates can signal the need to revisit your assumptions or extend the forecast. As Brian DeChesare, Founder of Mergers & Inquisitions, advises:
"You don't want UFCF to grow at 10% or 20% and suddenly drop to 2% in the Terminal Period. If it does, you need to re-think your assumptions or extend the analysis." - Brian DeChesare, Founder, Mergers & Inquisitions [8]
Finally, validate your normalized NOI by calculating the yield on cost to ensure it aligns with your Discounted Cash Flow (DCF) assumptions [9].
Discount Rate and Terminal Value
Once you've projected cash flows, the next step is to determine the discount rate and terminal value - two key factors that drive the final valuation. The discount rate reflects the risk-adjusted return investors expect, while the terminal value estimates the property's worth beyond the explicit forecast period.
Calculate the WACC
With cash flows in place, the next step is calculating the Weighted Average Cost of Capital (WACC), which serves as your discount rate in commercial real estate DCF models. Start by identifying your capital structure - specifically, the proportion of debt and equity funding.
- Cost of Debt (R₍D₎): This is based on the interest rate of the property's financing. Adjust it for the tax shield by multiplying it by (1 – Corporate Tax Rate) [10].
- Cost of Equity (R₍E₎): Use the Capital Asset Pricing Model (CAPM) or add a risk premium to the 10-year U.S. Treasury yield, which serves as your risk-free baseline [10][11].
Once you have these components, combine them using the formula:
WACC = (Weight of Equity × Cost of Equity) + (Weight of Debt × Cost of Debt × (1 – Tax Rate)) [10].
Typically, discount rates for commercial real estate transactions range between 8% and 12% [11]. With the discount rate calculated, you can move on to selecting the terminal value methodology.
Select a Terminal Value Method
The next step is choosing how to estimate the terminal value, which represents the property's value at the end of the forecast period. Two common approaches are:
- Perpetuity Growth Method: This assumes cash flows grow at a constant rate indefinitely, making it ideal for stable, long-term holdings [10][14].
- Exit Multiple Method: This approach is better suited for shorter-term strategies, such as private equity deals, where the property is sold after 3–7 years based on market multiples [13][14].
For the perpetuity growth method, use a growth rate between 2% and 3% - a range that aligns with historical inflation and GDP growth. This avoids unrealistic projections where the property outpaces the economy [12][15]. If you're using the exit multiple method, cross-check your assumptions to ensure the implied growth rate aligns with the market multiples [12][16].
Validate Terminal Value Contribution
After choosing a terminal value method, it's important to confirm that the terminal value's portion of the total valuation is reasonable. Typically, terminal value accounts for 60% to 80% of the total enterprise value in a standard DCF. For a 5-year DCF, it often makes up around 75%, while in a 10-year DCF, it may drop to about 50% [12][13][14].
If the terminal value exceeds 80%, the model may rely too heavily on long-term assumptions. As Dr. Andrew Stotz from Valuation Master Class explains:
"When the terminal value represents more than 80% of the total DCF value, your model is essentially a one-number bet on long-term growth, not a rigorous cash flow analysis." – Dr. Andrew Stotz, Valuation Master Class [15]
To ensure accuracy, run sensitivity tables to test how changes in WACC (±1%) and terminal growth rates (±0.5%) affect total enterprise value. Even a 0.5% shift in these assumptions can impact valuation by 10% to 15% [14]. For mature properties, if the implied terminal value exceeds 5–10× the current market cap, it's a sign to revisit your assumptions [14]. This sets the foundation for deeper sensitivity analysis in the next steps.
Validation and Sensitivity Analysis
After determining your discount rate and terminal value, it's time to validate your model and test how it holds up under different assumptions. Since we’ve already discussed cash flow projections and discount rate calculations, this step ensures your valuation is accurate and reliable. Even minor errors or shifts in assumptions can lead to significant deviations, so thorough checks are crucial before presenting your findings to stakeholders.
Check for Errors and Consistency
Begin by confirming that the type of cash flow aligns with the discount rate you're using. For example, Free Cash Flow to Firm (FCFF) should be paired with the Weighted Average Cost of Capital (WACC), while Free Cash Flow to Equity (FCFE) should use the Cost of Equity. Mixing these up can lead to inaccurate valuations.
Additionally, validate that depreciation aligns with 100% of Capital Expenditures (Capex) in the terminal year. This adjustment reflects a stable, mature property where only maintenance Capex is required[17]. If depreciation significantly lags behind Capex in the final forecast year, your model may be overstating growth or underestimating reinvestment needs. These checks lay a solid foundation for sensitivity analysis.
Build Sensitivity Tables
Once you've ensured consistency, focus on testing how sensitive your valuation is to changes in key assumptions. Sensitivity tables are a great way to see how shifts in variables like WACC, terminal growth rates, revenue growth, and exit multiples impact your results[18][20]. These variables are often the biggest drivers of Net Present Value (NPV) or Internal Rate of Return (IRR).
Here’s how to set up a sensitivity table:
- Link the output metric (e.g., NPV) to the top-left cell of the table.
- Use one variable (e.g., terminal growth rate) for the row headers and another (e.g., WACC) for the column headers[18].
- Test WACC within a range of ±1% to 3% to observe how present value shifts[19].
- Fix midpoint values in the headers to prevent circular references[18].
Be mindful of Excel’s limitations: sensitivity tables are memory-intensive. To avoid freezing, set calculations to "Automatic except for data tables"[18]. Also, build the table on the same sheet as the assumptions being tested - cross-sheet links can cause errors[18]. Finally, always verify that your terminal growth rate (g) is lower than your discount rate (r) to avoid invalid results[19].
Run Scenario Analysis
In addition to sensitivity tables, scenario analysis helps you evaluate how your model performs under different market conditions. Develop three key cases:
- Base Case: Reflects the most recent audited actuals (e.g., FY2025 data) and current trends like 3% rent growth[20].
- Upside Case: Assumes favorable conditions such as high occupancy, lower cap rates, and 5% to 6% rent growth.
- Downside Case: Accounts for challenges like a 1% interest rate hike, a 10% increase in operating expenses, and higher vacancy rates[20].
Use conditional formatting to highlight critical cells - like where NPV drops below your target threshold[20]. This approach turns your Discounted Cash Flow (DCF) model into a versatile tool for strategic decision-making, rather than just a static valuation exercise.
Conclusion
Key Takeaways
As the Boundev Team aptly says, "In real estate investment, the model is the deal."[1] A strong DCF model isn't just about numbers - it’s about a methodical, detailed approach across five essential areas: setup and structure, cash flow projections, discount rate calculations, terminal value methodology, and sensitivity analysis.
Start by creating a clean, well-organized structure. Tabs should follow a logical flow, and your forecast period - usually 5 to 10 years for property models - needs to be clearly defined[1]. Dive deep into tenant-level details using actual lease documents, factoring in variations like expense reimbursements and renewal probabilities. This level of detail helps pinpoint each tenant’s impact on property value and risk[2]. To keep your model reliable, include automated unit checks and maintain a version control log for tracking changes[3].
Once your model is built, test it rigorously. Use sensitivity tables to see how shifts in key variables - like rental income growth (2% to 6%), vacancy rates (±2% to 3%), or exit cap rates (±0.25% to 0.5%) - affect returns[1]. Even small adjustments can have a major impact, especially when institutional investors are aiming for IRRs of 8% to 12% for core assets and 15% to 20% for value-add strategies[1].
How The Fractional Analyst Can Help
If your project involves complex structures like mixed-use developments, affordable housing (LIHTC), or data center projects, expert support can make all the difference. The Fractional Analyst team specializes in creating custom models tailored to these unique scenarios[21]. They also assist with underwriting, asset management, investor reporting, and even pitch deck preparation.
Need ready-to-use tools? Their platform offers free downloadable financial models, including multifamily acquisition templates, mixed-use development models, and IRR matrices. For a more personalized approach, their Actual & Forecast Model bridges the gap between projected numbers and actual performance, helping refine risk assessments for future deals[21]. Prefer a self-service option? Their CoreCast platform provides tools to streamline the entire DCF modeling process. Whether you want hands-on support or a DIY solution, The Fractional Analyst is ready to help ensure your models withstand scrutiny.
FAQs
What makes a DCF model “advanced” in real estate?
An advanced DCF (Discounted Cash Flow) model in real estate is a highly detailed financial tool designed to address the intricate nature of property transactions. It dives deep into specifics, such as tenant-level lease details, fluctuating expense reimbursements, and adjustable capitalization and discount rates. These models are invaluable for running scenario analyses, testing assumptions under stress, and accounting for market risks. This level of precision makes them a critical component for accurate property valuations and developing refined investment strategies in the commercial real estate sector.
How do I pick the right discount rate for my deal?
When selecting a discount rate, align it with your valuation objective and the specific risk profile of the investment. This rate should capture opportunity cost, risk tolerance, and the time value of money. To ensure accuracy, base your choice on market-driven data, factoring in elements like comparable investment returns, property-specific risk premiums, and prevailing interest rates. Keep in mind, market conditions evolve - regularly revisiting and adjusting the rate helps reflect changes in trends, interest rates, and risk perceptions for more reliable valuations.
How can I tell if my terminal value is too high?
When calculating a terminal value, it's easy to overestimate if you base it on overly optimistic growth rates or generic industry benchmarks instead of solid, data-backed assumptions. To avoid this, make sure the terminal value reflects realistic, long-term economic conditions and aligns with the core principles of reinvestment. Overinflated growth projections are a frequent culprit behind excessive terminal values, so double-check that your estimates are built on reliable, well-supported data.