
How to Build a Real Estate DCF Model in Excel
A Discounted Cash Flow (DCF) model helps you determine the value of real estate by forecasting future cash flows and adjusting for time and risk. It’s a powerful tool for making informed investment decisions. Here’s a quick breakdown of how to create one in Excel:
Key Inputs:
Property Purchase & Sale Details: Include purchase price, acquisition costs, holding period (5–15 years), and exit assumptions like cap rates.
Income & Expenses: Forecast rental income, vacancy rates, and operating costs like insurance, taxes, and maintenance.
Capital Expenditures & Financing: Account for major upgrades, loan terms, and debt service.
Discount Rate: Reflects the time value of money and investment risk.
Model Structure:
Organize data in tabs like Assumptions, Cash Flow, Debt Schedule, and Summary.
Use Excel formulas like
NPV,IRR, andXNPVfor precise calculations.
Outputs & Analysis:
Calculate metrics like Net Present Value (NPV), Internal Rate of Return (IRR), and Equity Multiple.
Perform sensitivity analysis to test how changes in key assumptions impact results.
Quick Example:
Imagine buying a property for $1,000,000, holding it for 10 years, and selling it at a 6.5% cap rate. You’d forecast cash flows, discount them using a chosen rate, and calculate the terminal value to assess profitability.
By following these steps, you’ll build a reliable DCF model that guides your real estate investment decisions. Ready to dive deeper? Let’s get started.
Discounted Cashflow (DCF) Valuation Modeling for Real Estate
Required Inputs for Your Real Estate DCF Model
Creating a reliable Discounted Cash Flow (DCF) model for real estate starts with gathering accurate data. The quality of your inputs will directly influence the accuracy of your valuation, making it essential to collect precise details to support informed investment decisions.
Property Purchase and Sale Assumptions
Start by noting the purchase price and acquisition costs. These include expenses like closing fees, due diligence, legal fees, and any immediate capital improvements, minus any loan proceeds.
The holding period is another key factor. This defines the time frame for your analysis, which in commercial real estate typically ranges from five to fifteen years. Your chosen holding period should align with your investment goals.
Next, focus on your exit assumptions, which estimate the sale proceeds at the end of the holding period. This involves projecting an exit cap rate based on current market conditions and anticipated trends. Sale proceeds represent the net cash flow from selling the property. Be sure to account for factors like property improvements and market appreciation when making these assumptions.
Income and Expense Projections
Once you’ve established your purchase and sale assumptions, shift to forecasting income and expenses. Rental income forms the backbone of your cash flow projections, so it’s crucial to base these on both current operations and market trends.
Begin by gathering rent comparables from properties in the same area with similar features, such as size and amenities. Also, review local vacancy rates, employment growth, and population trends to assess the rental potential in your market. Use this data to make informed revenue assumptions that align with market fundamentals and ownership strategies.
Vacancy rates should reflect local market conditions. Even well-maintained properties experience some turnover, so use historical data and current trends to set realistic expectations.
For operating expenses, list recurring costs like maintenance, property management, insurance, taxes, HOA dues, and utilities. Property management fees typically range from 8% to 10% of the monthly rent collected. Additionally, allocate about 5–10% of gross rent for unexpected repairs or capital reserves.
A helpful benchmark is the 50% Rule, which suggests that operating expenses (excluding mortgage payments) can be roughly half of the gross rental income. While this provides a useful starting point, it’s important to adjust based on the specifics of your property.
Capital Expenditures and Financing Inputs
Beyond day-to-day operations, factor in major expenses and financing terms to complete the financial picture. Capital expenditures include significant property improvements, such as roof replacements or HVAC upgrades, that go beyond routine maintenance.
Set aside a capital reserve fund, typically between 5% and 15% of gross rental income, depending on the property’s age and condition. Newer properties generally require smaller reserves, while older ones may need higher allocations to cover major repairs.
Your debt assumptions also have a big impact on returns. Include details like loan amount, interest rate, amortization period, and any prepayment penalties. Fixed-rate loans offer predictable payments, while variable-rate loans require you to estimate future interest rate changes. Consider factors like loan-to-value ratios, debt service coverage, and potential refinancing scenarios during the holding period.
Discount Rate Selection
Finally, the discount rate plays a critical role in valuing future cash flows. This rate accounts for both the time value of money and the risks associated with the investment. A higher discount rate reduces the present value of future cash flows, while a lower rate increases it.
Choose a discount rate that aligns with your financial goals, risk tolerance, and alternative investment opportunities. Factors influencing this rate include the property’s risk profile, market conditions, asset type, and financing structure. Institutional investors often use target internal rates of return (IRRs) based on investor expectations and property risks. Real Estate Investment Trusts (REITs) typically start with their Weighted Average Cost of Capital (WACC) and adjust for specific asset risks.
For individual investors, it’s essential to evaluate your cost of capital and the unique risks tied to the property when setting a discount rate. Testing various discount rates can help you see how changes in your return assumptions affect the valuation.
How to Build Your DCF Model in Excel

Once you've gathered all your inputs, it's time to create the DCF model in Excel. Real estate models focus heavily on cash flows, supported by separate worksheets for revenues, expenses, financing, metrics, and returns. Unlike corporate models, which often emphasize accrual accounting, real estate models are almost entirely cash-flow-driven.
Setting Up the Model Structure
Start by organizing your workbook into dedicated worksheets: Assumptions, Cash Flow Analysis, Debt Schedule, and Summary. This setup keeps your model structured and simplifies future audits.
In the Assumptions tab, list key inputs like purchase price, acquisition costs, rental rates, expense ratios, cap rates, and your discount rate. Use named ranges in Excel to make formulas clearer and easier to manage. For example, instead of referencing cell B5 repeatedly, name it "Purchase_Price."
To minimize errors, use named ranges, data validation, and conditional formatting. These tools help ensure your assumptions are accurate and prevent mistakes that could distort your results. This preparation also streamlines calculations for cash flows, discounting, and terminal value.
In your Cash Flow Analysis tab, organize years across the top (typically covering 5–15 columns for the holding period) and line items down the left-hand side. Key components include rental revenues, operating expenses, and capital expenditures.
Forecasting Cash Flows
Create a simplified income and cash flow statement tailored to real estate. Start with revenue projections, followed by operating expenses, capital costs, and debt service.
For revenue forecasting, include base rental income, vacancy allowances, concessions, and expense reimbursements. Link these calculations to your Assumptions tab using named ranges. For example, if the base rent is $50,000 annually with a 5% vacancy rate, the effective rental income formula would be:=Base_Rent*(1-Vacancy_Rate)
Operating expenses should include property management fees, insurance, maintenance, utilities, and real estate taxes. Property management fees, for instance, often range from 8% to 10% of collected rent. A formula might look like this:=Effective_Rental_Income*Mgmt_Fee_Rate
Incorporate capital expenditures for items like tenant improvements, leasing commissions, and major repairs. These costs are often irregular. For example, you might spend $0 in years 1–2 but allocate $25,000 in year 3 for an HVAC replacement.
Calculate net operating income (NOI) by subtracting operating expenses from effective rental income. Then, deduct capital expenditures and debt service to determine annual cash flows. Real estate pro-formas typically exclude income taxes since properties are often owned by pass-through entities. Depreciation is also excluded as it’s a non-cash expense relevant mainly for taxes. These cash flow forecasts feed directly into the discounting process.
Discounting Future Cash Flows
Excel provides two primary formulas for discounting cash flows: NPV and XNPV. The NPV formula assumes cash flows occur at regular intervals, while XNPV adjusts for irregular timing.
“The Discounted Cash Flow (DCF) model in Excel is like a calculator. It helps figure out how much a company or investment is really worth.”
Here’s how these formulas work:
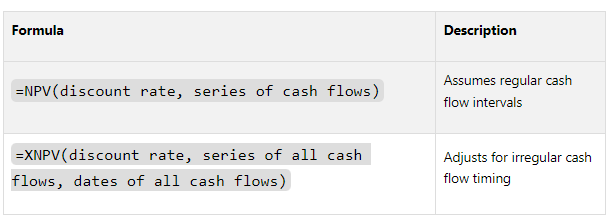
For example, imagine an investment made on June 15, 2023, of $100,000, followed by cash flows of $20,000 on December 31, 2023, $30,000 on December 31, 2024, and $40,000 on December 31, 2025. With an 8% discount rate, the XNPV formula would be:=XNPV(0.08, B2:B5, A2:A5)
Here, column B contains the cash flows, and column A contains the dates.
Calculating Terminal Value
The terminal value represents the property’s estimated worth at the end of the holding period and often accounts for a significant portion of total returns. The exit cap rate method is the most common approach in real estate.
To calculate, divide the final year’s NOI by the projected exit cap rate. For example, if the year 10 NOI is $75,000 and the exit cap rate is 6.5%, the terminal value would be:=$75,000/6.5% = $1,153,846
Alternatively, use the perpetuity growth method. Let’s say the final year’s cash flow is $70,000, the discount rate is 8%, and you expect 2% annual growth. The formula would be:=(70000*(1+0.02))/(0.08-0.02) = $1,190,000
Include this terminal value as the final cash flow in the XNPV calculation. The model sums the present values of operating cash flows and the terminal value, then subtracts the initial investment to calculate Net Present Value (NPV). A positive NPV means the investment exceeds your required return threshold.
Excel Formulas and Best Practices
Learn essential Excel functions and techniques to craft a professional real estate DCF (Discounted Cash Flow) model.
NPV and IRR Functions
Excel provides powerful tools for DCF calculations. Picking the right function ensures accurate analysis.
The NPV function calculates the net present value of cash flows that occur at regular intervals. For instance, you can use
=NPV(0.07, cash_flow_range)and then subtract the initial investment to get the final NPV.The IRR function computes the internal rate of return for a series of cash flows. The formula is simple:
=IRR(values)MIRR, or Modified Internal Rate of Return, improves on IRR by factoring in both the cost of investment and reinvestment rates. This function is especially handy for comparing projects with varying durations or cash flow patterns.
Here’s a quick comparison of these functions:
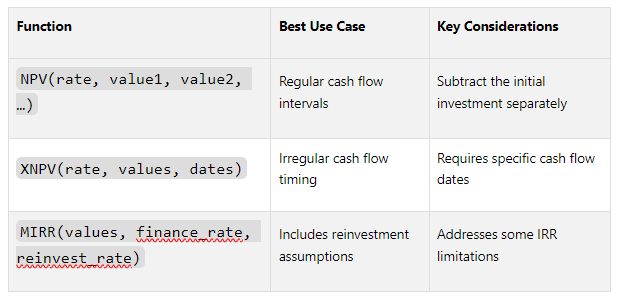
For regular cash flows, use IRR. For cash flows with irregular timing, XIRR is the better choice. MIRR is ideal when reinvestment assumptions are critical.
Once you’ve mastered these, the next step is to incorporate debt service calculations to account for financing impacts on cash flows.
Debt Service Calculations
Financing plays a major role in real estate investments, making accurate debt service calculations essential. Excel’s IPMT and PPMT functions help break down loan payments into interest and principal components.
For example, if you have a $750,000 loan at 4.5% interest over 25 years, you can calculate the monthly payment with:
=PMT(0.045/12, 25*12, -750000)
To split this into interest and principal for any given month:
Interest portion:
=IPMT(0.045/12, month_number, 25*12, -750000)Principal portion:
=PPMT(0.045/12, month_number, 25*12, -750000)
By linking these formulas across your projection period, you can track the loan balance and cash flows over time. For variable-rate loans, tie the interest rate to your assumptions tab and use IF statements to model rate changes. For instance:
=IF(YEAR(date_cell)<=2026, Base_Rate, Base_Rate+Rate_Increase)
Linking Assumptions for Scenario Analysis
Dynamic linking of assumptions is crucial for flexible scenario analysis. A well-structured DCF model separates inputs from calculations and uses dynamic references to adapt to changing scenarios.
Organize your assumptions into two groups:
Static inputs: Items like purchase price or initial cap rate.
Dynamic inputs: Variables like rental growth rates or expense ratios.
Use named ranges to make formulas easier to understand and minimize errors. For example, the OFFSET function allows dynamic scenario selection. Here's how Wall Street Prep describes it:
“The formula in cell E6 tells the model to set the beginning reference point in cell E11, move down the equivalent number of rows as stated in cell C2, and move ‘0’ columns to the right.”
You might use something like:=OFFSET(Revenue_Base, Scenario_Number, 0)
to dynamically pick a revenue growth scenario.
To keep your model clear:
Use color coding: Inputs in blue, formulas in black, and external links in green.
Add checks to ensure accuracy. For example:
=IF(ABS(Total_Uses-Total_Sources)>1, "ERROR: Sources and Uses don't balance", "OK")
Consolidate these checks in a dedicated "Check Tab" for easy monitoring.
Avoid hardcoding numbers directly into formulas. Instead of writing:=Revenue*0.05
for a 5% management fee, reference the assumption cell:=Revenue*Mgmt_Fee_Rate
Flags (like 1/0 or TRUE/FALSE) can help model different investment phases. For instance, a renovation flag might trigger capital expenditures during specific years:=IF(Renovation_Flag=1, Renovation_Cost, 0)
Finally, document all assumptions thoroughly. Include units (e.g., per square foot, annually, or monthly) and sources for key inputs. This makes the model easier to understand, whether you’re presenting to investors or revisiting it later.
Transform Your Real Estate Strategy
Access expert financial analysis, custom models, and tailored insights to drive your commercial real estate success. Simplify decision-making with our flexible, scalable solutions.
Understanding Results and Running Sensitivity Analysis
Once your DCF model is complete, the next step is to interpret the results and examine how key assumptions could influence your returns. This process transforms subjective judgment into a more data-driven evaluation of risks and opportunities. Let’s break down the key outputs, sensitivity techniques, and value drivers that shape your analysis.
Main Outputs of the DCF Model
A well-structured DCF model typically generates three essential metrics that together paint a picture of your investment's potential:
Net Present Value (NPV): This figure indicates whether the investment creates value. A positive NPV means the opportunity adds value, while a negative NPV suggests it may not meet your criteria.
Internal Rate of Return (IRR): Expressed as an annualized percentage, the IRR helps you compare investment opportunities and assess whether the potential returns justify the risks.
Equity Multiple: This metric shows how much your initial investment grows over the holding period. For instance, an equity multiple of 2.0x means you double your money, while lower multiples reflect smaller overall gains. It’s a straightforward way to communicate returns to stakeholders.
One key insight: A high IRR paired with a low equity multiple often reflects a short holding period. Balancing these metrics is essential for a comprehensive evaluation.
Sensitivity Analysis Techniques
Sensitivity analysis is all about testing how changes in assumptions impact your results. Excel offers various tools to make this process dynamic and insightful:
One-Way Sensitivity Analysis: Start by varying a single input while keeping others constant. For example, you can explore how different exit cap rates affect your IRR by listing a range of cap rates and linking them to your IRR calculation.
Two-Way Sensitivity Analysis: Take it a step further by varying two inputs at the same time - such as exit cap rates and discount rates. This approach creates a grid of outcomes, helping you see how shifts in market conditions and required returns influence performance.
Scenario Manager: Excel’s Scenario Manager allows you to save and compare multiple what-if scenarios (e.g., "Base Case", "Optimistic", "Conservative"). You can adjust assumptions like rental growth, vacancy rates, or exit timing for each scenario.
To make the results more digestible, use conditional formatting to transform raw numbers into heatmaps. These visual tools make it easier to spot patterns and communicate findings effectively.
Finding Your Value Drivers
Just as accurate inputs are critical for your Excel model, identifying the key factors that drive value is essential for interpreting results and refining your approach. Focus on the variables that have the biggest impact on returns:
Revenue Growth Rates: Even a small change in annual rent growth can have a significant effect on overall returns. This makes it a primary driver to monitor closely.
Exit Cap Rates: These are especially important for shorter holding periods. A shift of just one percentage point in cap rates can dramatically alter projected sales proceeds, emphasizing the need to stay informed about local market trends.
Other factors, like operating expense ratios and capital expenditure assumptions, also matter but may vary in importance depending on the property type. Tools like tornado diagrams can help you rank these variables based on their impact, guiding you to focus on areas with both high influence and uncertainty. This ensures your due diligence efforts are targeted where they matter most.
Using The Fractional Analyst for Advanced Modeling
Excel-based DCF models are great for building foundational skills, but there are times when you need something more advanced - whether it’s faster analysis, specialized expertise, or tools that go beyond Excel’s limitations. That’s where The Fractional Analyst steps in, offering both expert services and self-service tools to take your DCF models and investment analysis to the next level. Here’s how these resources can refine your approach.
Custom Financial Analysis Services
The Fractional Analyst provides access to top-tier financial analysts who focus on commercial real estate, without the costs of hiring full-time staff. Starting at $95 per hour, their flexible services can support any phase of your deal cycle.
These analysts can handle a wide range of DCF modeling tasks. Whether you need entirely new models or adjustments to fit specific asset classes or investment strategies, they’ve got you covered. This is particularly helpful when working with complex properties like mixed-use developments or unconventional financing structures that don’t fit into standard Excel templates.
“Whether you’re a sponsor, developer, or operator, our fractional analyst team can plug in on a one-time, part-time, or full-time basis to drive accuracy, bandwidth, and speed across your deal cycle or portfolio.”
But it doesn’t stop at modeling. The team also supports market research to refine your assumptions, ongoing portfolio analysis for asset management, and investor reporting to present your findings effectively. They can even create pitch decks that turn complex financial data into clear, persuasive narratives for stakeholders.
CoreCast Platform for Self-Service Modeling
If you prefer to manage your own models, The Fractional Analyst’s CoreCast platform is a game-changer. Currently in beta at $50 per user per month (with prices expected to rise to $105 per user per month after launch), CoreCast is built for real-time, collaborative modeling, moving beyond the limitations of traditional Excel files.
The platform’s CoreCast Underwriter serves as a powerful modeling tool that accommodates various asset classes and strategies. Unlike static Excel files, CoreCast allows multiple team members to work on the same model simultaneously, eliminating version control headaches.
CoreCast also offers tools like Portfolio Insights, which aggregates data from multiple deals to give you a broader view of your portfolio. The Pipeline Tracker has been particularly effective for users like a Director of Acquisitions at a REIT, who shared:
“With the Pipeline Tracker, we reduced deal slippage by 30% over two quarters. The visibility and accountability it provides are game-changers.”
The platform’s Forecasting Tools take scenario modeling to a new level. You can adjust variables like rent growth rates, cap rates, and expense inflation to see real-time updates to your projections. This makes sensitivity analysis more dynamic and intuitive than Excel’s built-in tools.
Another standout feature is CoreCast’s integration capabilities. The platform connects with your existing financial and property management systems, pulling in actual performance data to compare against your projections. This not only saves time but ensures your models are always up-to-date.
“CoreCast transformed how we communicate portfolio performance to stakeholders. We now spend more time analyzing data, and less time assembling it.”
Free Financial Models and Tools
For those just starting or looking for quick solutions, The Fractional Analyst offers a library of free, customizable financial models. These Excel templates include multifamily acquisition models, mixed-use development models, and IRR matrices - all paired with instructional materials to help you get the most out of them.
“We’re giving away all of our off-the-shelf, excel-based financial models - completely free!”
Each download comes with instructional sheets that outline industry practices, step-by-step videos, and underwriting demos. These resources are perfect for smaller firms or individual investors who want high-quality templates without the steep learning curve.
With its mix of expert services, a collaborative platform, and free resources, The Fractional Analyst offers a comprehensive toolkit for real estate financial analysis. Whether you need expert guidance, a hands-on modeling platform, or just a solid starting point for your DCF analysis, they provide flexible solutions that grow alongside your business.
Conclusion
Creating a real estate DCF model in Excel requires careful attention to detail and a solid foundation of accurate inputs. Key elements like precise rent rolls, realistic expense estimates, appropriate cap rates, and well-thought-out discount rates form the backbone of a dependable model. These inputs are the building blocks that ensure your cash flow projections and overall analysis are on point.
Structuring your Excel model with clarity is just as important. Using proper formulas for NPV and IRR, linking assumptions consistently across your spreadsheet, and maintaining an organized layout are crucial for building a reliable framework. But the real power of your model lies in sensitivity analysis. By testing how changes in key variables impact your outcomes, you can validate your assumptions and improve the reliability of your projections. Keep in mind that terminal value often accounts for a significant portion - up to 75% - of the total valuation, which makes it essential to rigorously evaluate your exit assumptions.
Once you've mastered the basics, advanced tools and resources can take your analysis to the next level. Platforms like The Fractional Analyst's services and CoreCast provide additional layers of insight and precision.
Whether you're just starting out or refining your approach, combining Excel fundamentals with advanced tools and constant testing of assumptions can transform the way you analyze real estate investments. The key is to stay grounded in accurate data, build structured models, and adapt to the ever-changing market landscape.
FAQs
-
When creating a discounted cash flow (DCF) model for real estate in Excel, accuracy is everything. To get dependable results, you’ll want to steer clear of a few common mistakes that can throw your calculations off track.
Unrealistic assumptions: It’s tempting to plug in optimistic growth rates or convenient discount rates, but doing so can lead to skewed valuations. Don’t overlook key expenses like property maintenance, management fees, insurance, and taxes - they can have a big impact on the bottom line.
Data input errors: Even small errors, like misplaced decimals or incorrect formulas, can derail your model. Double-check every input, and consider using Excel’s data validation tools to catch mistakes before they cause bigger problems.
Skipping sensitivity analysis: If you don’t test how changes in key factors - like rent growth or cap rates - affect your model, you might end up overly confident in your projections. Sensitivity analysis helps you see the full range of possible outcomes.
By keeping assumptions grounded in reality, carefully reviewing data inputs, and running scenarios to test your model’s resilience, you’ll create a DCF model you can rely on for real estate analysis.
-
The discount rate in real estate investment represents the minimum return an investor expects to compensate for the associated risk. This rate takes into account factors like the property's risk level, current economic landscape, and the length of the investment period. Typically, it includes a risk premium added to a baseline rate, such as the 10-year U.S. Treasury yield, and usually falls within the 5% to 12% range for commercial properties.
When setting the discount rate, it's important to evaluate the opportunity cost of capital, the investor's desired return, and prevailing market conditions. Conducting a detailed analysis ensures the rate reflects the property's risk and potential performance, enabling smarter investment choices.
-
Using CoreCast for real estate discounted cash flow (DCF) modeling brings a host of benefits that set it apart from traditional Excel-based approaches. Its user-friendly interface and ready-to-use, customizable templates make the modeling process much smoother, cutting down on time and minimizing the chances of mistakes.
What really stands out are CoreCast's advanced capabilities, such as scenario analysis, automation, and real-time data integration. These features not only enhance accuracy but also simplify decision-making. With these tools, professionals can create more dependable forecasts and refine their investment strategies, making CoreCast a go-to solution for contemporary real estate analysis.