
Sell or Hold? CRE Decision Frameworks

If I had to reduce this decision to one rule, it would be this: hold only when the present value of future after-tax cash flow and a later sale is higher than the after-tax cash you can get today.
In plain terms, I’m comparing three paths:
- Sell now and keep the after-tax proceeds
- Hold and collect cash flow, then sell later
- Refinance and hold if debt can free up cash without hurting returns too much
A good headline sale price can mislead you. What matters is:
- NOI and exit cap rate
- NPV first, then IRR and equity multiple
- Taxes, including capital gains and depreciation recapture
- Debt payoff, prepayment costs, and refinance terms
- Lease rollover, tenant credit, and near-term CapEx
- Whether a 1031 exchange keeps more equity in play
Here’s the short version: if a 50 to 100 bps move in exit cap rate wrecks the hold case, or if ±10% NOI changes the answer, I’d treat that as a warning. And if taxes or debt maturity cut too deeply into net proceeds or future cash flow, the choice can flip fast.
Hold vs Sell Decisions in Commercial Real Estate | CRE Strategy Guide
sbb-itb-df8a938
Quick comparison
| Path | Main upside | Main risk | What I’d check first |
|---|---|---|---|
| Sell now | Immediate after-tax liquidity | Tax drag and lost future upside | Net sale proceeds after debt, fees, and taxes |
| Hold | More income and later sale value | Exit pricing risk, rollover, CapEx, loan maturity | Incremental NPV versus selling now |
| Refinance and hold | Pull out cash without an immediate sale tax bill | Higher debt service and tighter coverage | Whether new loan terms still support the hold case |
Before I make the call, I’d document the same five steps every time: set the asset goal, model hold cash flow, calculate net sale proceeds, run sensitivity tests, and line it up with taxes, debt, and portfolio fit. That keeps the decision tied to math instead of guesswork.
Core Metrics That Drive the Sell-or-Hold Decision
No single metric settles this on its own. You need to look at the full picture. The table below shows what each metric tends to point to.
| Metric | Signals Hold | Signals Sell |
|---|---|---|
| NPV | Positive incremental NPV versus selling now | Negative incremental NPV; today's cash outperforms future flows |
| IRR | Hold-period IRR exceeds your best alternative use of capital | Hold-period IRR is lower than what a new acquisition could deliver |
| Equity Multiple | Meaningful upside remains in the business plan | Multiple is stagnant; equity should be redeployed |
| Cash-on-Cash | Current yield exceeds your hurdle or financing cost | Yield is thin versus other uses of capital |
| After-Tax Proceeds | Tax friction makes selling inefficient | Strong net proceeds enable a 1031 exchange into a larger asset |
DCF and NPV: The Primary Decision Rule
The main test is straightforward: does holding the asset create more value than selling today?
A discounted cash flow (DCF) model helps answer that. It projects the remaining hold-period NOI, estimates the sale price at exit, and discounts those future cash flows back at the investor's required return. That discount rate should line up with the asset's risk and your opportunity cost.
If incremental NPV is positive, the hold case wins. If it's negative, selling now is the better move. That's why NPV is the anchor for the rest of the review.
IRR, Equity Multiple, and Current Yield Comparisons
IRR and equity multiple help test whether the hold story still makes sense.
For example, a hold-period IRR may clear your hurdle rate and still be the wrong call if the same equity could earn more in another deal. That's the part many owners miss. The issue isn't just whether the asset performs. It's whether it performs well enough compared with the next place that capital could go.
Cash-on-cash return adds a more immediate check. If current yield sits below your hurdle rate or even below your financing cost, that's a warning sign. Put plainly, the equity in the deal may be doing more work for the property than for you.
Return metrics matter, but they don't tell the whole story. Taxes and deal costs can flip the answer.
After-Tax Proceeds and Transaction Costs
The gross sale price is not the number that should drive the call.
Broker fees, closing costs, and any prepayment penalty on current debt can take a solid chunk out of proceeds. Once you factor in taxes and closing costs, the equity left to reinvest can be much lower than the headline sale price. That's why timing matters so much. Tax drag can make a sale look weak at one stage of the hold period and much better later on.
A qualifying 1031 exchange can change the math. If you qualify, you can defer the tax bill and keep more capital available for the next deal. That means more equity stays in play instead of leaking out at closing.
From there, the next step is simple: check whether market conditions and property performance support waiting.
Market and Property Signals That Favor Selling or Holding
Market and property signals can outweigh the model. In plain English: sometimes the numbers say one thing, but the asset and the market are telling you something else.
Use the table below as a gut check. It shows when a signal leans toward selling now versus holding longer.
| Indicator | Favors Selling | Favors Holding |
|---|---|---|
| Cap Rate Trend | Compression has peaked; expansion expected | Current rates are wide (trough); recovery expected |
| NOI Trend | Declining or peaked | Growing or mark-to-market rent upside |
| Lease Rollover | Large near-term rollover risk | Stable, long-term staggered maturities |
| Tenant Credit | Deteriorating quality | Strong, credit-worthy tenancy |
| Maintenance | Major upcoming CapEx (roof, HVAC) | Recently renovated; deferred maintenance addressed |
| Rent Growth | Weakening fundamentals | Favorable submarket supply-demand trends |
When Market Conditions Support a Sale
A sale makes more sense when your exit price depends on aggressive rent growth or cap rates moving in your favor. That kind of story can look fine in a spreadsheet, but it leaves little room for error.
If market pricing is richer than your underwriting supports, sellers usually have the upper hand. Add weaker leasing fundamentals and a big chunk of lease rollover in the near term, and the risk of holding starts to climb.
Upcoming capital needs matter too. A full roof replacement or HVAC system can take a bigger bite out of net proceeds than many owners expect. Wait too long, and that cost can sneak up on you.
When Asset Performance Supports a Longer Hold
A longer hold tends to work when the property is already producing strong cash flow, the tenants have solid credit, and rents are still below market. That's often where upside lives. You're not betting on a heroic turnaround; you're letting the asset keep doing its job while you close the gap between in-place rents and market rents.
Using Market-Cycle Context Without Over-Relying on Forecasts
Cycle context helps, but it shouldn't drive the whole decision. Think of it as a check on your base case, not a crystal ball.
Stress-test the hold scenario with higher cap rates and lower NOI. If the deal still holds up, the case for waiting has some support. If it falls apart under that pressure, that's your margin-of-safety test.
Next, translate these signals into exit value, taxes, and debt capacity.
Exit Modeling, Taxes, Debt, and Refinance Options
Once you've read the market, the next step is simple: put each exit path into dollars. Look at three options side by side:
- sell now
- hold
- refinance and hold
Then judge each one on after-tax equity, debt service, and NPV. Residual value, tax drag, and loan terms often decide the outcome.
Focus on net equity, not sticker price.
| Metric | Immediate Sale | Hold | Refinance and Hold |
|---|---|---|---|
| After-Tax Proceeds | High (net of CG + recapture) | None (cash flow only) | Moderate (tax-free debt proceeds) |
| Leverage | 0% (loan repaid) | Existing (e.g., 50–70%) | Increased (e.g., 70–75% LTV) |
| Debt Service | None | Stable | Higher (larger loan balance) |
Residual Value and Exit Cap Rate Sensitivity
Small cap-rate moves can have a big effect on value. A 50–100 bps shift in the exit cap rate can materially change sale price, IRR, and equity multiple. A common rule is to increase the current market cap rate by 5–10 bps for each hold year [1].
It also helps to run downside and upside cases, not just a base case. Test sensitivity at ±25 bps on the exit cap and ±10% on NOI [1]. If a pretty small cap-rate move breaks the hold case, that's a strong sign the sale case may be better.
U.S. Tax Impact on Disposition Timing
Timing matters because taxes hit hard. Selling triggers capital gains tax and depreciation recapture. Holding pushes both into the future, and a §1031 exchange can defer them longer.
That means exit timing shouldn't sit in a silo. Tie it to debt maturity, lease rollover, and your tax calendar.
Debt Maturity, Refinance Capacity, and Hold Alternatives
Debt maturity is often the factor that forces the call. You may want to hold, but when a loan comes due in a higher-rate market, a new loan can squeeze cash flow enough to change the math.
A cash-out refinance can be a valid hold alternative. It lets you pull out equity without triggering immediate capital gains taxes, which can free up cash for property upgrades or other uses while you keep the asset. But there's no free lunch here. Higher loan proceeds mean higher debt service, and that needs to be stress-tested against NOI projections.
Choose a cash-out refinance only if the added debt service still gives you a better NPV than keeping the current loan.
A Step-by-Step CRE Decision Process and Final Takeaways
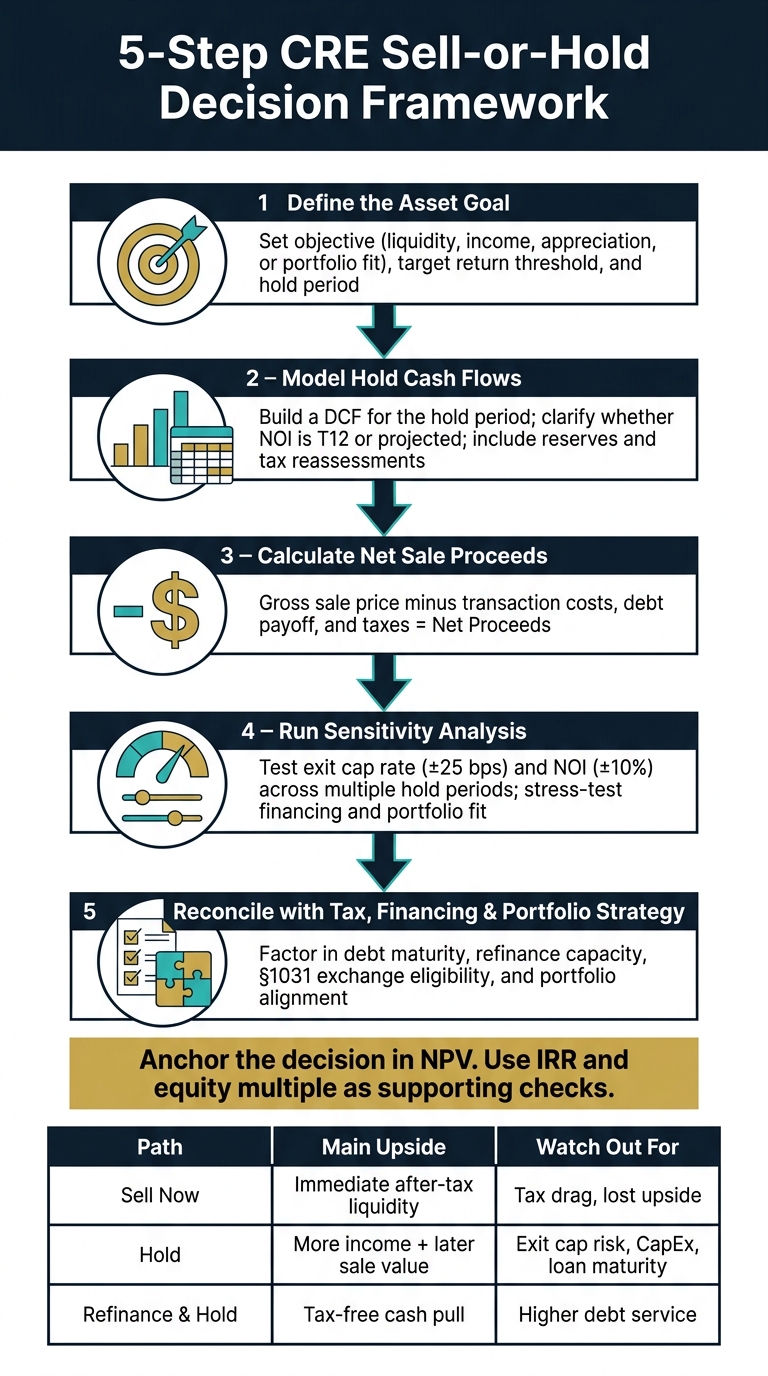
5-Step CRE Sell-or-Hold Decision Framework
The sell-or-hold call doesn't have one right answer for every deal. But it can follow the same process each time. That's the point: keep emotion out, let the math lead, and turn assumptions into a recommendation you can defend.
5 Steps to Document a Sell-or-Hold Recommendation
Start by defining what the asset is supposed to do.
- Define the asset goal
Pick the main objective: liquidity, income stability, appreciation, or portfolio fit. Set the target return threshold and hold period at this stage. - Model hold cash flows
Build a DCF for the hold period. Be clear about whether NOI is T12 or projected, and note whether it includes reserves and property tax reassessments. - Calculate net sale proceeds
Subtract transaction costs, debt payoff, and taxes to arrive at net sale proceeds. - Run sensitivity analysis
Test exit cap rate and NOI across multiple hold periods. Then check how the result changes once taxes, financing, and portfolio fit come into play. - Reconcile with tax, financing, and portfolio strategy
Add debt payoff, refinance capacity, 1031 exchange eligibility, and portfolio fit. The final recommendation needs to line up with the model result - built on NPV, exit cap rate, taxes, and debt maturity - and with financing and portfolio strategy. A decision that looks right on its own can look very different once you place it in context.
That sequence keeps the recommendation tied to the same assumptions used in both the hold and sale models.
Key Points to Carry Forward
Use NPV as the anchor. IRR and equity multiple are supporting checks.
Taxes, capital expenditures, and refinancing terms can each shift the outcome in a big way. A sale that looks clean at the top line may look very different after taxes. A hold that looks strong on paper may fall apart when a loan matures.
FAQs
How do I choose the right discount rate for hold analysis?
Start with current cap rates for similar properties in your submarket. Then make a conservative adjustment for where you think the market cycle will be when you sell.
A simple rule of thumb is to add 5 to 10 basis points of cap rate expansion for each year in your planned hold period.
It also helps to run a sensitivity test. Model exit cap rates at plus or minus 25 basis points, then sanity-check the output by asking a simple question: Would a buyer today realistically pay that price?
When does a 1031 exchange make selling more attractive?
A 1031 exchange can make a sale far more appealing for an investor who wants to defer capital gains taxes and roll the proceeds into a like-kind property that’s similar, larger, or set up to perform better.
It matters most when the property has gone up in value by a lot. And because IRS rules and deadlines are strict, this kind of exchange needs to be part of the exit plan early.
How should I compare a refinance with an immediate sale?
Run both scenarios through the same financial model and use the same assumptions across each case. That way, you’re comparing apples to apples.
For a sale, calculate net proceeds after:
- Loan payoff
- Transaction costs
- Capital gains taxes
For a refinance, calculate net proceeds after:
- Existing loan payoff
- Prepayment penalties
- Closing costs
Then compare the numbers that matter most: IRR, equity multiple, net present value, and post-refinance cash flow.
It also helps to pressure-test the model. Try different exit cap rates and NOI cases to see how each path holds up if the market shifts or property income comes in above or below plan.
Numbers alone don’t tell the whole story, though. Liquidity needs matter. Tax impact matters. And so does ongoing risk. A refinance may put cash in your pocket today while keeping the asset in play, but it also leaves you exposed to future leasing, debt, and market risk. A sale may create a tax bill now, yet it can also turn paper equity into cash and cut future exposure.