
Geospatial Data in CRE Market Forecasting

Geospatial data is transforming commercial real estate (CRE) forecasting by providing precise, location-based insights. From satellite imagery to real-time mobility patterns, this data helps investors identify growth markets, mitigate risks, and improve returns. Key takeaways:
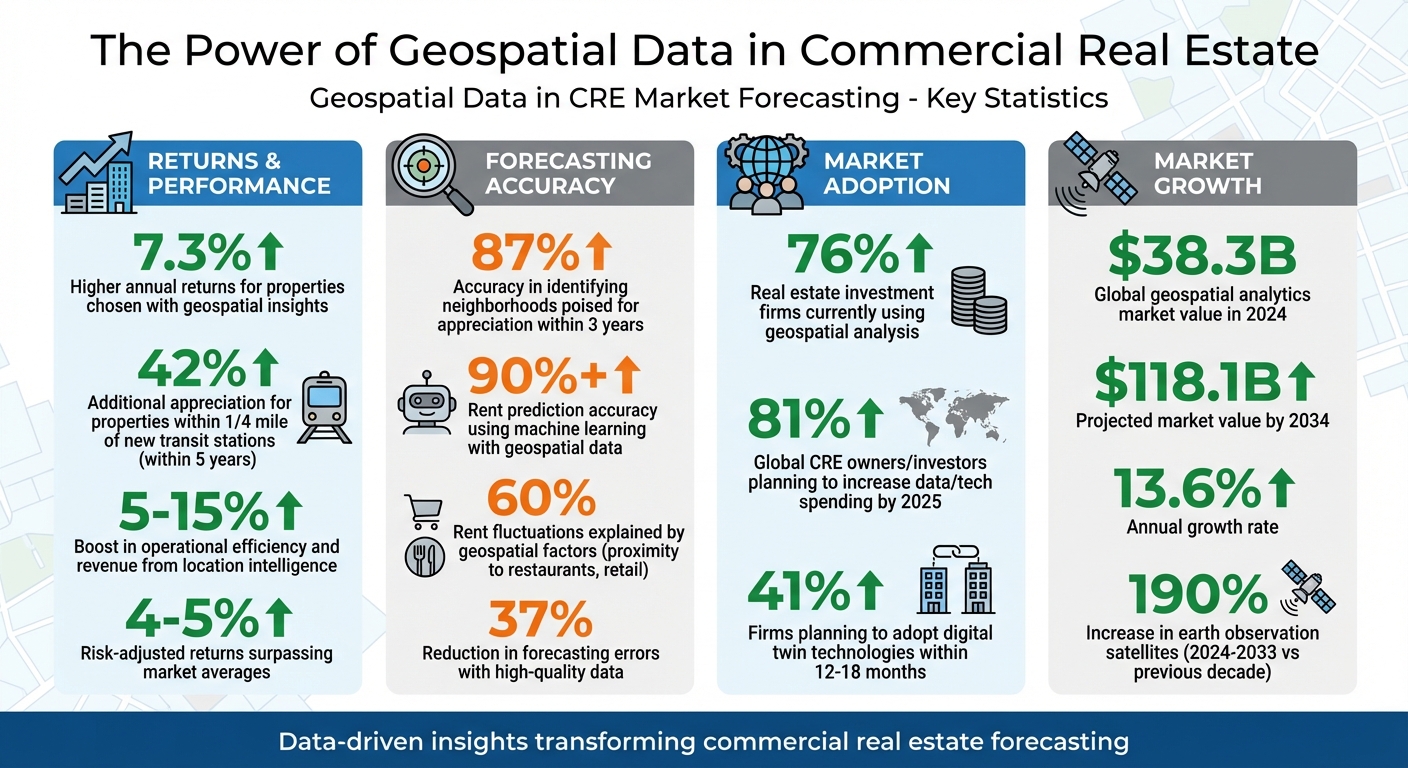
- Higher Returns: Properties chosen with geospatial insights deliver 7.3% higher annual returns.
- Market Trends: Tools like foot traffic analysis and zoning data improve site selection and tenant strategies.
- Risk Management: Environmental data highlights risks like flooding or climate exposure, aiding smarter investments.
- Advanced Tools: Platforms like ArcGIS and CoreCast integrate geospatial data into financial models, improving decision-making accuracy.
These tools and techniques are reshaping how CRE professionals forecast trends, value properties, and strategize investments.
Geospatial Data Impact on Commercial Real Estate Returns and Forecasting Accuracy
Using Location Data in Commercial Real Estate Research | Moody's Analytics

Main Types of Geospatial Data for Market Forecasting
Geospatial data provides a wealth of information that can help investors and developers better understand property potential and market trends. By analyzing demographic, economic, and environmental patterns, commercial real estate (CRE) forecasting becomes more precise and actionable. These three data categories - demographic, economic and infrastructure, and environmental - offer a comprehensive view of opportunities and risks in the market. Let’s dive into the details, starting with demographic data.
Demographic and Population Data
Demographic data focuses on factors like population size, age distribution, income levels, and consumer habits [9][8]. This data helps investors align property types with the needs and preferences of the local population. For example, overlaying population density with shopping behaviors can guide decisions about retail or residential developments [7][9].
One standout metric here is net migration. In 2019, states like Florida and Texas saw the highest net in-migration, while California and New York experienced significant out-migration [11]. This type of information helps investors identify growth markets. Similarly, median household income data ensures that a property’s use - whether it’s luxury apartments or high-end retail - matches the purchasing power of the area’s residents [11][13].
Markets with diverse age and racial demographics tend to offer stability for long-term investments [11]. Tracking shifts at the ZIP-code or neighborhood level can provide early signals of emerging opportunities. For instance, in Austin, TX, demand for multifamily housing has increasingly shifted toward areas like East Austin and Riverside [12].
| Factor Type | Key Data Points | Actionable CRE Insight |
|---|---|---|
| Market-Level | Net Migration, Age Distribution, Median Income | Highlights growth areas and suitable asset classes [11][13] |
| Submarket-Level | Neighborhood Mobility, Household Composition | Identifies hyperlocal trends and areas of progress [11][14] |
| Property-Level | Visitor Psychographics, Foot Traffic Volume | Guides tenant selection, rent pricing, and property valuation [13][14] |
Economic and Infrastructure Data
Economic conditions and infrastructure are equally critical in evaluating CRE opportunities. This category includes mobility patterns, transportation networks, zoning laws, and points of interest (POIs). For example, understanding foot traffic and visitor dwell times can predict the success of retail spaces and inform operational strategies [7][9]. Aggregated GPS data is especially useful for identifying thriving versus underperforming retail locations.
Proximity to infrastructure projects can significantly impact property values. Properties within a quarter-mile of new transit stations appreciated 42% more than similar properties within five years of the construction announcement [6]. Zoning and land use data further help investors navigate legal requirements and assess a site’s development potential [7][1].
Points of interest, such as nearby competitors or complementary businesses, can reveal market saturation or synergy opportunities. Additionally, tracking upcoming transit developments and public works projects is crucial, as these often lead to value premiums [6][7].
Predictive models that incorporate permits, infrastructure projects, and traffic trends are highly effective, with up to 87% accuracy in identifying neighborhoods poised for significant appreciation within three years [6].
Environmental and Physical Data
Environmental data encompasses climate risks, flood zones, wildfires, seismic activity, and topography [7][1][9][10]. This data is essential for evaluating risks, securing insurance, and determining a property’s long-term viability.
Climate and natural risk assessments help investors avoid costly mistakes. Maps showing flood zones, wildfire boundaries, and seismic activity are indispensable for understanding environmental exposure [7][1].
Satellite imagery and aerial data provide valuable insights into construction progress, land use changes, and physical features like elevation and vegetation [9][1][10]. These tools offer continuous monitoring of variables like temperature and land cover, complementing traditional vector data such as roads and boundaries [8][10]. Some cities, like Des Moines, have even developed 3D digital models that integrate topography, buildings, and infrastructure. These models allow developers to visualize future impacts and designs before construction begins [6].
"In the world of CRE, informed decisions grounded in thorough research and spatial analysis pave the way to profitability and mitigate risks associated with volatile markets." - xMap [7]
Tools and Techniques for Geospatial Data Analysis
To excel in commercial real estate (CRE) forecasting, having reliable geospatial platforms and analytics is no longer optional - it's essential. As Ryan Passe, VP of Operations at Sands Investment Group, explains:
"The time when brokers could lean on gut feelings to get the best deal is gone. Today, if you're not paying attention to the numbers, you're losing money" [3].
Let’s explore the tools that transform raw geospatial data into actionable insights for CRE professionals.
GIS Platforms: ArcGIS and CoreCast

ArcGIS, developed by Esri, stands as a leader in the CRE industry. It provides access to over 15,000 variables, including demographics, consumer behavior, and market potential [15]. Its tools enable 2D and 3D analysis, site selection, and real-time data processing [15]. For instance, Mid-America Real Estate Group improved its site selection by analyzing neighborhood trends, while Colliers Utah used housing data to forecast CRE growth across the state [15].
For those looking for AI-powered automation, Atlas offers GeoAI capabilities that simplify bulk data processing. It automates tasks like calculating risk scores, classifying locations, and generating property descriptions without requiring complex infrastructure [17].
CoreCast, The Fractional Analyst's geospatial platform, bridges the gap between spatial analysis and financial modeling. Unlike broader platforms like ArcGIS, CoreCast focuses directly on connecting geospatial insights with CRE financial workflows. This tool streamlines the integration of spatial data into financial decision-making processes. Currently in beta, it’s available at $50 per user per month, with pricing expected to rise to $105 after further development.
Spatial Mapping Techniques for CRE
Mapping techniques bring clarity to dense datasets, making it easier to identify trends and opportunities. Here are three key methods:
- Heatmaps and tessellation: These techniques aggregate data into grids (hexagons or squares), making it easier to spot high-density areas or "hot spots." For example, mapping foot traffic in retail areas can quickly reveal thriving corridors versus underperforming zones [18][15].
- Density-based clustering: Algorithms like DBSCAN and HDBSCAN filter out noise to isolate significant clusters of activity. These methods are particularly useful for identifying retail hubs and business districts in regions with varying population densities [18].
- Proximity analysis: This approach measures how property values shift based on their distance from amenities like transit stations, parks, or employment centers [4][2]. Properties within a quarter-mile of new transit stations, for example, have appreciated 42% more than comparable properties over five years [2]. Additionally, properties selected using geospatial analytics tend to deliver 7.3% higher annual returns compared to traditional methods [4].
These techniques, when combined with effective data governance and financial modeling, can significantly enhance market forecasting.
Data Integration and Custom Solutions
Integrating geospatial data into CRE operations works best when done in phases. Start with a small market, validate results against traditional methods, and then scale up to larger portfolios [4]. This process requires close collaboration between GIS experts and finance teams to ensure spatial data aligns with financial models [4].
Data governance plays a crucial role in maintaining the integrity of geospatial analysis. Organizations must implement strict protocols for data quality, update schedules, and version control [4]. By layering different data types - such as points of interest, building footprints, and foot traffic patterns - alongside financial data, teams can create a more comprehensive market view [3].
The Fractional Analyst offers tailored financial models that incorporate geospatial insights, helping teams translate raw data into actionable strategies for underwriting, asset management, and market research. For those who prefer a self-service approach, CoreCast provides a cloud-based system that handles large data volumes and supports real-time updates across teams [4]. These solutions help bridge the gap between raw data and strategic decision-making.
Predictive geospatial models now achieve about 87% accuracy in identifying neighborhoods likely to see significant value increases within three years [2]. Still, as McKinsey cautions:
"Advanced analytics cannot serve as a crystal ball. In most cases, it should only support investment hypotheses, not generate them" [3].
The takeaway? These tools are invaluable for refining and validating investment strategies, but they should complement - not replace - deep market expertise.
How Geospatial Data Improves CRE Market Forecasting
The rise of data-driven analysis is transforming the commercial real estate (CRE) industry, revealing patterns and opportunities that traditional methods often miss. From selecting the perfect site to accurate property valuation and tracking demographic trends, geospatial data is reshaping how decisions are made.
Site Selection and Market Entry Strategies
Choosing the right location is no longer about relying on city-wide averages. Hyperlocal analysis digs deeper, uncovering opportunities that broader studies might overlook. For retail properties, this could mean identifying areas with high foot traffic and strong revenue potential by analyzing mobile phone signal patterns. For office spaces, it might involve prioritizing proximity to daily conveniences like cafes, transit hubs, and grocery stores [3].
The importance of location is clear. In Boston, for instance, home prices within a quarter-mile of a Starbucks surged by 171% between 1997 and 2014 - outpacing the city’s average by 45 percentage points [5]. Meanwhile, tools like GeoAI are automating the process of spotting underutilized but high-value parcels zoned for development, helping developers act quickly when opportunities arise [5][20]. By layering point-of-interest (POI) data with purchasing power per capita, investors can assess a property’s potential return on investment with greater precision before committing resources [3].
Property Valuation Using Spatial Layers
Geospatial data is also enhancing property valuation. While traditional methods rely heavily on historical sales data and physical inspections, newer approaches integrate dynamic, multi-layered models that account for real-time changes in infrastructure and the environment [1]. This means that even properties with similar historical metrics can show vastly different growth trajectories when spatial factors are considered [3].
Geoenrichment adds depth to property records by incorporating external data points like air quality, walkability scores, and proximity to schools or hospitals. For example, in October 2024, a geospatial analysis in King County, Washington, used proximity buffers - 0.5 miles around schools and 5 miles around hospitals - to identify homes with high appeal based on their location [22].
| Feature | Standard Valuation Methods | Geospatial-Enhanced Techniques |
|---|---|---|
| Primary Data Inputs | Historical sales comps, physical inspections, local broker insights [1] | Satellite imagery, mobility patterns, zoning layers, environmental risk [1][7] |
| Analysis Frequency | Periodic snapshots (quarterly or annually) [1] | Dynamic updates, potentially weekly using high-resolution imagery [1] |
| Accuracy Benefits | Reliable in stable, high-volume markets | Identifies undervalued areas and uncovers outliers in shifting markets [1][21] |
| Limitations | Relies on lagging indicators; may miss emerging trends or hidden risks [1] | Requires specialized expertise and complex data integration [1] |
Advanced techniques like Geographic Weighted Regression (GWR) provide more nuanced and defensible valuations than traditional linear models [21]. For example, a December 2024 study in Hamilton County, Tennessee, analyzed 873 residential sales using geospatial variables such as walk scores and air quality to produce more accurate housing market forecasts [23].
Tracking Demographic Shifts and Foot Traffic
Real-time mobility data is sharpening market forecasts by linking consumer behavior to asset performance. Foot traffic, for instance, acts as a real-time indicator of demand, helping investors spot submarket momentum early [3][13]. Mobility analytics, which track visit frequency, dwell time, and visitor origins, allow for precise catchment analysis to understand consumer behavior [3][24]. In Seattle, a study on multifamily properties revealed that geospatial factors like nearby high-rated restaurants and evolving retail landscapes explained 60% of rent fluctuations. Machine learning models using this data achieved rent prediction accuracy exceeding 90% [5].
Tracking population movements at the neighborhood and ZIP code levels helps identify emerging commercial hubs and future growth areas for multifamily and retail investments [13][24]. For retail properties, analyzing peak visitation times and visitor profiles helps optimize tenant mixes, whether for dining, entertainment, or services [13]. By overlaying demographic data with mobility insights, asset strategies can align with the economic profiles of incoming residents, supporting long-term demand [13].
Data quality plays a critical role in reducing forecasting errors. High-quality data can cut errors by 37%, while poor-quality data is responsible for 62% of missteps [19]. Indraneel Dutta Baruah emphasized this point:
"How well we clean and understand the data has a tremendous impact on the quality of the results" [19].
sbb-itb-df8a938
Combining Geospatial Data with Financial Models
Geospatial insights have already proven their worth in site selection and property valuation. But when these insights are integrated directly into financial models, they take forecasting for commercial real estate (CRE) to another level. By weaving geospatial data into financial tools, static spreadsheets evolve into dynamic systems that reflect real-world conditions, offering a clearer picture of market potential.
How Financial Models Enhance CRE Forecasting
Traditional financial models - built on metrics like NOI (Net Operating Income), cap rates, and IRR (Internal Rate of Return) - become far more precise when paired with geospatial variables such as points of interest (POIs), building footprints, and foot traffic patterns [3]. For example, machine learning models that utilize nontraditional geospatial data have achieved over 90% accuracy in predicting three-year rental rates for multifamily properties [5]. One study found that factors like proximity to highly rated restaurants and shifts in nearby retail stores accounted for 60% of rent fluctuations. This level of insight allows investors to price deals more accurately and reduce credit risks [5].
The integration of geospatial data also paves the way for real-time updates via APIs and data warehouses. Modern platforms can now sync geospatial data with financial models, enabling real-time forecasting updates [16][25]. Additionally, this automation supports scenario analysis, helping investors simulate portfolio performance under different macroeconomic conditions, even down to the submarket level [16]. Properties selected using geospatial tools have been shown to deliver annual returns that are 7.3% higher, while risk-adjusted returns for investors using these tools often surpass market averages by 4–5% [6][4].
There are already real-world examples of these benefits in action. Blackstone’s targeted residential acquisitions and JLL’s repositioning of shopping centers both used geospatial data to outpace market benchmarks, proving the effectiveness of these models in identifying high-growth opportunities [6].
Geospatial Integration with The Fractional Analyst's Services
The Fractional Analyst complements these advanced financial models by seamlessly integrating geospatial insights into investment strategies. Whether you’re an individual investor exploring basic concepts or an institutional player managing complex portfolios, this platform offers tools to incorporate spatial data at every stage of the investment process.
- Free Models: These financial templates are designed for beginners and include basic spatial layer compatibility. They’re perfect for students and individual investors who want to explore market fundamentals without spending a dime.
- Custom Analysis: For developers and firms that need deeper insights, this option provides tailored geospatial analysis. Features include AI-powered predictive modeling (with 87% accuracy in identifying appreciating neighborhoods), site-specific risk layers, and ROI projections. Pricing is available upon request.
- CoreCast: Currently in beta at $50 per user per month, CoreCast is an all-in-one workflow solution for asset managers and institutional investors. It integrates AI-enabled underwriting, real-time market data, scenario analysis, and one-click reporting. Once fully launched, the price is expected to increase to $105 per user per month.
Here’s a quick breakdown of how the platform’s service plans integrate geospatial data with financial modeling for CRE:
| Plan Name | Key Geospatial Features | Pricing | Best For |
|---|---|---|---|
| Free Models | Basic mapping, static demographic layers, standard financial templates | $0 | Individual investors and students exploring market basics |
| Custom Analysis | AI-powered predictive modeling, custom spatial regression, site-specific risk layers | Contact for Quote | Developers and firms needing advanced site and ROI analysis |
| CoreCast | AI-enabled underwriting, real-time market insights, scenario analysis, one-click reports | $50/mo (Beta) | Asset managers and institutional investors requiring a full workflow solution |
The Fractional Analyst’s real strength lies in its ability to merge quantitative data - like foot traffic and market trends - with qualitative insights, such as community sentiment and tenant reviews [7]. This combination offers a more nuanced view of a property’s potential, helping investors avoid common pitfalls tied to outdated or incomplete data. As McKinsey aptly put it:
"Advanced analytics cannot serve as a crystal ball. In most cases, it should only support investment hypotheses, not generate them" [5].
Future Trends in Geospatial Data for CRE
The commercial real estate (CRE) industry is undergoing a transformation, thanks to the integration of geospatial insights with modern technologies like artificial intelligence (AI), real-time data streams, and digital twin technology. What once relied on intuition and retrospective analysis is now being driven by data, enabling investors to identify opportunities and risks faster than ever. Let’s dive into how AI and real-time data are leading this shift.
AI and Machine Learning in Geospatial Analytics
AI is changing the game by analyzing massive amounts of non-traditional data that would overwhelm human analysts. Machine learning models now process hyperlocal data - such as mobile phone signals, Yelp reviews, and satellite images - offering insights down to the city-block level [5][27]. This granular approach uncovers opportunities that broader market studies might miss.
For example, a McKinsey study from October 2018 revealed that machine learning models predicting three-year rent trends for multifamily properties in Seattle achieved over 90% accuracy. These models included unconventional factors like proximity to top-rated restaurants and shifts in nearby retail stores, which accounted for 60% of rent fluctuations [5].
AI also excels in tracking development pipelines. Predictive algorithms utilize satellite imagery to monitor construction progress and assess building activity in real time [27]. In addition, sentiment analysis tools scan social media and photos to evaluate neighborhood appeal, helping investors determine whether an area is on the rise or decline.
Investment in these technologies is growing rapidly. A survey found that 81% of global CRE owners and investors plan to increase spending on data and technology by 2025. Meanwhile, 41% aim to adopt digital twin technologies within the next 12 to 18 months [26]. Digital twins - virtual replicas of physical assets - allow firms to simulate scenarios like energy retrofits or the financial impact of climate resilience strategies before committing resources.
However, AI isn’t a one-size-fits-all solution. As Nicolas Duran, Associate Director at CBRE, explained:
"The process of forecasting will not change, in essence. It will remain a combination of data and expert judgement. But going forwards, expert forecasters could have AI-enhanced data and more accurate models at their disposal" [27].
Human expertise remains essential for interpreting AI outputs, navigating political risks, and understanding local nuances that raw data cannot capture. While AI enhances predictive power, real-time data offers immediate insights into market dynamics.
Growing Use of Real-Time Geospatial Data
Real-time data is becoming the new standard in CRE. Instead of relying on outdated quarterly reports, investors now use live feeds from sources like mobile geolocation, credit card transactions, and IoT sensors to monitor market trends as they happen [27][5]. This approach bridges the gap between slower real estate metrics and faster-moving external data, enabling near-instant adjustments to predictions.
The financial benefits are clear. Companies leveraging location intelligence report a 5–15% boost in operational efficiency and revenue [6]. Real-time tracking of building permits, construction activity, and foot traffic helps investors pinpoint emerging hotspots before traditional benchmarks catch up.
The infrastructure supporting this shift is expanding at an unprecedented rate. Between 2024 and 2033, an estimated 5,401 earth observation satellites are expected to launch - a 190% increase compared to the previous decade [29]. In April 2024, Tata Advanced Systems Limited partnered with Satellogic to launch TSAT-1A, India’s first privately built sub-meter resolution Earth observation satellite, delivering high-resolution imagery for commercial analytics [28]. The global geospatial analytics market, valued at $38.3 billion in 2024, is projected to grow to $118.1 billion by 2034, with an annual growth rate of 13.6% [28].
Technological advancements like 5G networks are accelerating this trend, enabling faster transmission of high-resolution geospatial data. Cloud-native systems, which held a 56% market share in 2024, ensure seamless collaboration and real-time processing [28]. Many platforms now incorporate machine learning for automatic feature extraction, reducing the time analysts spend on manual tasks [29].
Despite these advancements, real-time data usage comes with challenges. Privacy concerns around mobility data demand strict compliance with regulations on personally identifiable information (PII) [28][1]. Additionally, high infrastructure costs and bandwidth limitations for non-cloud systems can slow adoption [28][29]. To address these issues, successful firms are forming cross-functional teams that combine data scientists, GIS experts, and experienced CRE professionals to align spatial analysis with business objectives [6].
As McKinsey cautioned:
"If companies fail to act now, they run the risk of adapting too late" [5].
These advancements are reshaping CRE forecasting, setting the stage for even more breakthroughs in the years to come.
Conclusion
Geospatial data has reshaped how commercial real estate (CRE) professionals predict market trends. Gone are the days of relying solely on intuition - today, cutting-edge tools can identify high-growth neighborhoods with up to 87% accuracy, potentially increasing annual returns by 7.3% and even reaching as much as 15–20% in some cases [6][2][4][30].
Currently, 76% of real estate investment firms use geospatial analysis in their decision-making processes [6][4]. This shift is creating a competitive divide. As urban economist Edward Glaeser aptly put it:
"In real estate, the art of the deal is increasingly becoming the science of the data" [6][2].
Firms that resist adopting these technologies risk falling behind as advancements like AI, real-time data streams, and digital twin models become industry norms.
Thriving in this rapidly evolving landscape takes more than just collecting data - it requires weaving it into a cohesive strategy. The best results come from blending algorithm-driven insights with local market knowledge, supported by teams that connect data scientists with experienced CRE professionals. Tools like CoreCast bring it all together, combining geospatial analysis with financial modeling, underwriting, and portfolio management to make decision-making more efficient [6].
To stay ahead, firms should embrace real-time dashboards, pilot innovative projects, and integrate spatial insights into every financial model. This creates a feedback loop that sharpens forecasting and informs tactical decisions. Whether you're selecting a site, evaluating climate risks, or monitoring demographic changes, geospatial data turns forecasts into actionable strategies.
For those ready to take the next step, The Fractional Analyst provides the expertise and tools to navigate this transformation. Our team specializes in tailored geospatial analysis and underwriting support, while CoreCast scales these insights seamlessly. Visit thefractionalanalyst.com to learn how geospatial data can drive smarter decisions in commercial real estate.
FAQs
How does geospatial data enhance returns in commercial real estate?
Geospatial data takes the old adage "location, location, location" and turns it into a measurable advantage, giving commercial real estate (CRE) investors a clear path to better returns. By combining details like satellite imagery, foot traffic data, and demographic trends with property-specific information, investors can pinpoint locations primed for success. This approach helps identify properties with higher rent potential, lower vacancy risks, and more reliable tenants - ultimately leading to stronger cash flow and improved capitalization rates.
Geospatial analytics also sharpens market forecasting by applying advanced tools like spatial statistics and machine learning. These technologies dig into massive datasets to predict key trends, such as rent growth, vacancy rates, and market absorption, with greater accuracy. This level of insight allows investors to stay ahead of market shifts. For instance, properties located near popular landmarks or major retail chains often appreciate faster, highlighting the power of precise location intelligence.
For those ready to tap into these benefits, The Fractional Analyst provides tailored geospatial-driven market research, underwriting support, and data-rich financial models. These services are designed to help CRE professionals maximize returns while minimizing risks.
What types of geospatial data are used in commercial real estate forecasting?
In the world of commercial real estate (CRE) forecasting, geospatial data plays a key role. The most frequently used types include vector datasets (like property boundaries, points of interest, and street networks), raster imagery (such as satellite and aerial photos), and location-based data (covering foot traffic, mobility patterns, and demographic details).
This data helps professionals spot trends, evaluate market dynamics, and make smarter decisions about properties and investments. By digging into geospatial data, CRE experts can gain insights into how locations perform today and identify potential opportunities for the future.
How is geospatial data used to improve financial forecasting in commercial real estate?
Geospatial data plays a key role in improving financial forecasting for commercial real estate (CRE) by turning location-based insights into practical inputs for financial models. Factors like the distance to transit hubs, population density, and nearby amenities are derived from Geographic Information System (GIS) layers, including satellite imagery, demographic data, and foot-traffic patterns. These factors are then integrated into models to fine-tune cash flow predictions, property valuations, and risk evaluations.
Using techniques such as spatial statistics, analysts can bridge data gaps and produce more accurate property forecasts. Tools like The Fractional Analyst’s CoreCast platform make this process even smoother by automating data integration and offering real-time updates. This empowers CRE professionals to generate detailed forecasts, perform stress tests, and pinpoint risks or opportunities with greater certainty.