
How Q4 CRE Transaction Volume Compares to the Rest of the Year
As we settle into December 2025, the commercial real estate (CRE) market feels remarkably different than it did just twelve months ago. The “survive ‘til ‘25” mantra—chanted by nervous investors throughout the grim transaction volumes of 2023 and 2024—has largely played out. But did we survive? And more importantly, what does "thriving" look like in the next decade?
Current data from Q4 2025 compared to the first three quarters of this year suggests we are witnessing a pivotal "bottoming out" process. We are moving away from the rate-shock paralysis of the early 2020s and into a new cycle defined not by cheap debt, but by demographic inevitability, artificial intelligence, and asset bifurcation.
Here is the deep dive into the numbers, the last decade’s lessons, and the next decade’s forecast.
Part I: The 2025 Snapshot (Q4 vs. Q1-Q3)
The "Slow Thaw" of Q1-Q3 2025
The first nine months of 2025 were characterized by a cautious return to deal-making. After transaction volumes cratered in 2023 (down nearly 50% year-over-year at the time) and stagnated in 2024, 2025 brought the first signs of pulse.
Q2 2025 Volume: National transaction activity reached roughly $115 billion, a 3.8% increase year-over-year. It wasn't a boom, but it was positive territory.
The Drivers: Multifamily and Office (surprisingly) accounted for 44% of this volume, though the "Office" numbers are skewed by high-quality Class A trophy assets trading hands, masking the distress in Class B/C sectors.
Pricing: We saw pricing "discovery" finally happen. Sellers capitulated on 2021 valuations, accepting the new reality of higher cap rates. By Q3 2025, single-property sales counts had rebounded to levels seen in 2013/2015—a healthy indicator of market liquidity returning.
Q4 2025: The Pivot Point
As we close out the year, Q4 is shaping up to be the strongest quarter of 2025, driven by institutional capital moving off the sidelines before the new year.
The "Year-End Sprint": Preliminary Q4 data suggests a transaction volume uptick as investors look to deploy capital before 2026. However, unlike the frantic "deal rushes" of 2019 or 2021, this Q4 activity is strategic and selective.
Sector Divergence:
Industrial: Remains the "golden child," though cooling slightly. Vacancy stabilized around 6.8% in Q3, but Q4 is seeing a rush for logistics hubs near power sources (more on that later).
Multifamily: The surprise winner of Q4. After two years of oversupply from the 2022 construction boom, demand has finally caught up. Net absorption is on track to surpass new deliveries for the first time since early 2022.
Retail: Neighborhood grocery-anchored centers are trading aggressively in Q4. The "necessity retail" thesis has proven recession-proof.
Residential Note: The residential market in 2025 remains largely frozen compared to CRE. While commercial investors adjust cap rates to match borrowing costs, homeowners are "locked in" to low mortgage rates from 2020-2021. Q4 residential inventory is creeping up, but sales volume remains historically low. The residential "thaw" will likely lag the commercial recovery by another 12-18 months.
Part II: The 10-Year Rearview (2015–2025)
To understand where we are going, we must look at the wild ride of the last decade. The chart of 2015–2025 resembles a mountain peak followed by a jagged canyon.
Phase 1: The Cheap Money Era (2015–2019)
Trend: Steady, boring, profitable growth.
Cap Rates: Compressed steadily as interest rates hovered near historic lows.
Office: Was considered a "safe" bond-like asset. (In hindsight, this was the peak of the old office model).
Phase 2: The Pandemic Distortion (2020–2021)
The Event: COVID-19 halted the world, then unleashed a torrent of liquidity.
The Result: A speculative frenzy. 2021 saw record-breaking transaction volumes ($1.14 Trillion peak). Industrial and Multifamily valuations detached from reality, driven by "infinite" rent growth projections.
Phase 3: The Hangover (2022–2024)
The Shock: The Fed’s aggressive rate hikes shattered the "negative leverage" game.
The Fallout: Transaction volume plummeted. 2023 was a ghost town for brokers. 2024 was a year of "extend and pretend," where lenders worked with borrowers to avoid foreclosure, delaying the pain.
Phase 4: The Great Stabilization (2025)
Current State: We have landed. Valuations in many sectors have reset 20-30% below 2021 peaks. The "bid-ask" gap has closed. The market is healthier, albeit poorer, than it was three years ago.
Transform Your Real Estate Strategy
Access expert financial analysis, custom models, and tailored insights to drive your commercial real estate success. Simplify decision-making with our flexible, scalable solutions.
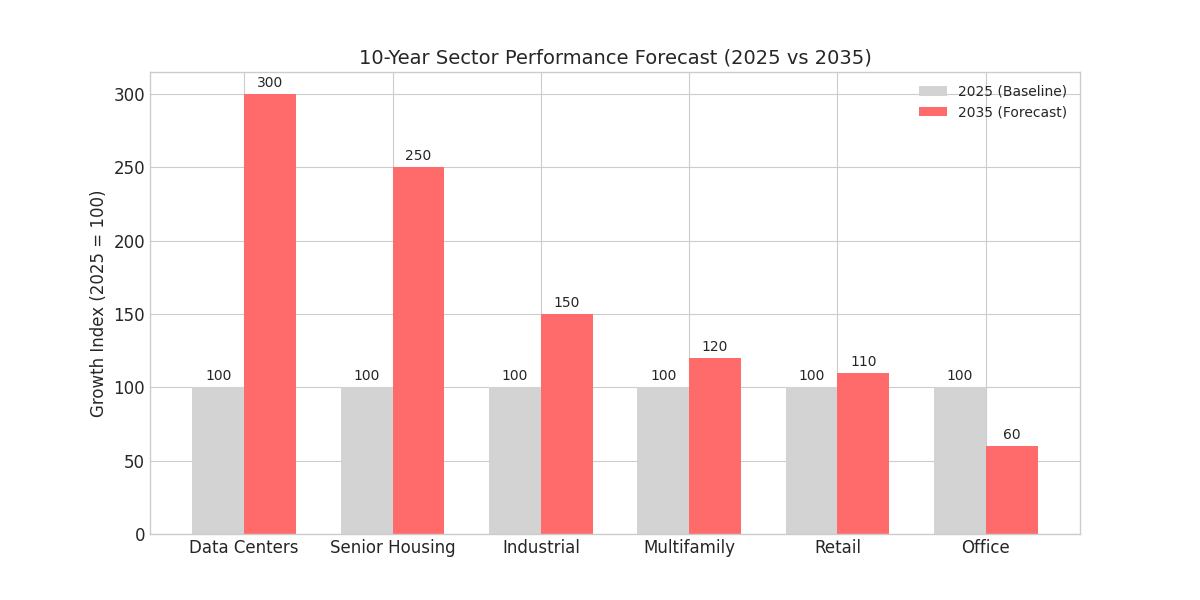
Part III: The 10-Year Forecast (2026–2035)
If the last decade was defined by Interest Rates, the next decade will be defined by Utility and Demographics. We are entering a cycle where "a rising tide lifts all boats" is no longer true. We will see extreme bifurcation: assets that serve the economy of 2035 will soar; those built for the economy of 2015 will rot.
1. The "Power" Play: Data Centers & Industrial (2026–2030)
The single biggest constraint on real estate in the next 5 years will not be land or capital—it will be electricity.
The AI Factor: AI compute needs are doubling rapidly. Data centers are the new "oil fields."
Forecast: Industrial real estate will morph. We will see a premium on "powered shells"—warehouses with massive grid connectivity. Properties in markets with cheap, reliable power (and water for cooling) will trade at massive premiums, regardless of their proximity to city centers.
Prediction: By 2028, "Power Availability" will replace "Location, Location, Location" for industrial underwriting.
2. The Silver Tsunami: Senior Housing & Healthcare (2026–2035)
Demographics are destiny. The first Baby Boomers turn 80 in 2026.
The Crisis: We are woefully under-supplied for high-acuity senior living (Memory Care/Assisted Living).
Forecast: This will be the best-performing asset class of the late 2020s. Expect a massive wave of capital shifting from Office to Senior Living conversion (where physically possible) and new ground-up development.
Prediction: "Wellness Real Estate" becomes a standard asset class, blending hospitality, healthcare, and multifamily.
3. The Office Reckoning: Obsolescence & Rebirth (2026–2030)
The "Return to Office" mandates of 2024/2025 have stabilized occupancy, but the amount of space needed has permanently shrunk.
The Bifurcation: Trophy assets (Class A+, eco-friendly, amenity-rich) will hit record rents in NYC, Miami, and Dallas.
The Graveyard: The "commoditized glass box" built in 1990 in a suburban office park is effectively worth land value.
Forecast: 2026-2030 will be the era of Adaptive Reuse. We will see aggressive policy changes (tax incentives) to turn zombie office buildings into residential, vertical farming, or educational hubs.
4. Climate as Currency (2030–2035)
By the 2030s, insurance volatility will force a repricing of risk.
The Shift: Insurers are already pulling out of high-risk zones (coastal Florida, wildfire California).
Forecast: "Climate Resilience" will become a line item on appraisals. A building with its own microgrid, flood mitigation, and LEED Platinum status will trade at a significantly lower cap rate (higher value) than a comparable building without these features, simply because it is insurable.
Comparison Table: The Market Eras
| Feature | The "Boom" (2015 - 2021) | The "Correction" (2022 - 2024) | The "Future" (2026-2035) |
|---|---|---|---|
| Primary Driver | Low interest rates | Federal reserve policy | Demographics & technology |
| Star Asset | Multifamily & industiral | Cash & treasuries | Data centers & BTR |
| Office Market | Stable / Bond-like | Heavily distressed | Bifurcated (trophy / distressed) |
| Key Risk | Over-leveraged | Refinancing / rates | Power supply / insurance |
| Strategy | Buy & hold | Survive | Value-add & repurpose |
The Verdict: How to Act Now
The "wait and see" period is over. Q4 2025 is the signal that the market floor has been established.
For the next 10 years, you cannot simply buy "beta" (market average) and expect returns. The easy money is gone. The wealth of the next decade will be made by investors who can answer two questions:
Does this building serve the aging population? (Senior Housing/Healthcare)
Does this building support the digital infrastructure? (Data Centers/Logistics)
If the answer is no, proceed with extreme caution.
Sources for Transaction Data & 2025 Snapshot
These reports provided the Q1, Q2, and Q3 2025 transaction volumes, the year-over-year recovery comparisons, and sector-specific performance metrics (Multifamily rebound, Office distress, etc.).
Altus Group: US Commercial Property Investment & Transactions - Q3 2025
Altus Group: US Commercial Real Estate Transaction Analysis – Q2 2025
CBRE: U.S. Quarterly Figures (Q3 2025)
J.P. Morgan: 2025 Commercial Real Estate Midyear Outlook
Sources for Historical Context & 2026-2035 Forecast
These reports supplied the historical context (2015–2024 cycles, 2021 peak, 2023 crash) and the forward-looking themes for the next decade, including the rise of Data Centers, Senior Housing, and the Office Bifurcation.
PwC/Urban Land Institute (ULI): Emerging Trends in Real Estate to Watch in 2026
NAR (National Association of REALTORS®): The Top 10 Issues to Watch in Commercial Real Estate in 2026
MSCI: 2024 Real Estate Market Size Report
The Motley Fool: Commercial Real Estate Investing Statistics 2024
Sources for Q4 2025 Outlook & Sentiment
These sources provided the "cautious optimism" and specific sector forecasts for the final quarter of the year, including interest rate sensitivity and lending condition improvements.
The Real Estate Roundtable (RER): Q4 2025 Sentiment Index
Brady Martz: Commercial Real Estate Market Forecast: Key Trends for Q4 2025
Deloitte Insights: 2026 Commercial Real Estate Outlook