
How to Analyze Submarket Dynamics for CRE

If I want a sound CRE submarket read, I need to answer one question fast: is this area getting tighter, staying flat, or getting softer?
That call usually comes from five inputs: vacancy, absorption, rents, concessions, and new supply. If I define the right local boundary, pull matching data, compare the subject to nearby peers, and read those numbers together, I can turn raw market data into underwriting assumptions for rent growth, lease-up, downtime, and exit cap rate.
Here’s the full process in plain English:
- Set the submarket based on where tenants actually shop for space
- Pick the true comp set by filtering for type, size, age, location, and tenant base
- Pull matching data with the same dates, units, and market boundary
- Read supply and demand together instead of looking at one metric alone
- Compare asking rent vs. effective rent to see what deals are doing
- Judge the market direction as strengthening, stable, or weakening
- Push that view into the model through revenue and exit assumptions
A few numbers matter more than most. For example, a submarket with 8.5% vacancy, 150,000 SF of net absorption, and $28.50/SF effective rent tells a very different story than one with 10.1% vacancy, (45,000) SF of absorption, and heavier concessions. That’s why I don’t read market stats one by one. I read them as a group.
| Step | What I look at | What it tells me |
|---|---|---|
| 1 | Boundary + comp set | Who the subject actually competes with |
| 2 | Vacancy, absorption, rents, pipeline | What the local market is doing |
| 3 | Supply vs. demand | Whether conditions are tightening or softening |
| 4 | Asking rent, effective rent, concessions | What tenants are paying in practice |
| 5 | Market call + model inputs | How I set rent growth, lease-up, downtime, and exit |
Bottom line: I’m not trying to collect more market data. I’m trying to make a clear call that I can support in an investment memo, lender package, or deal model.
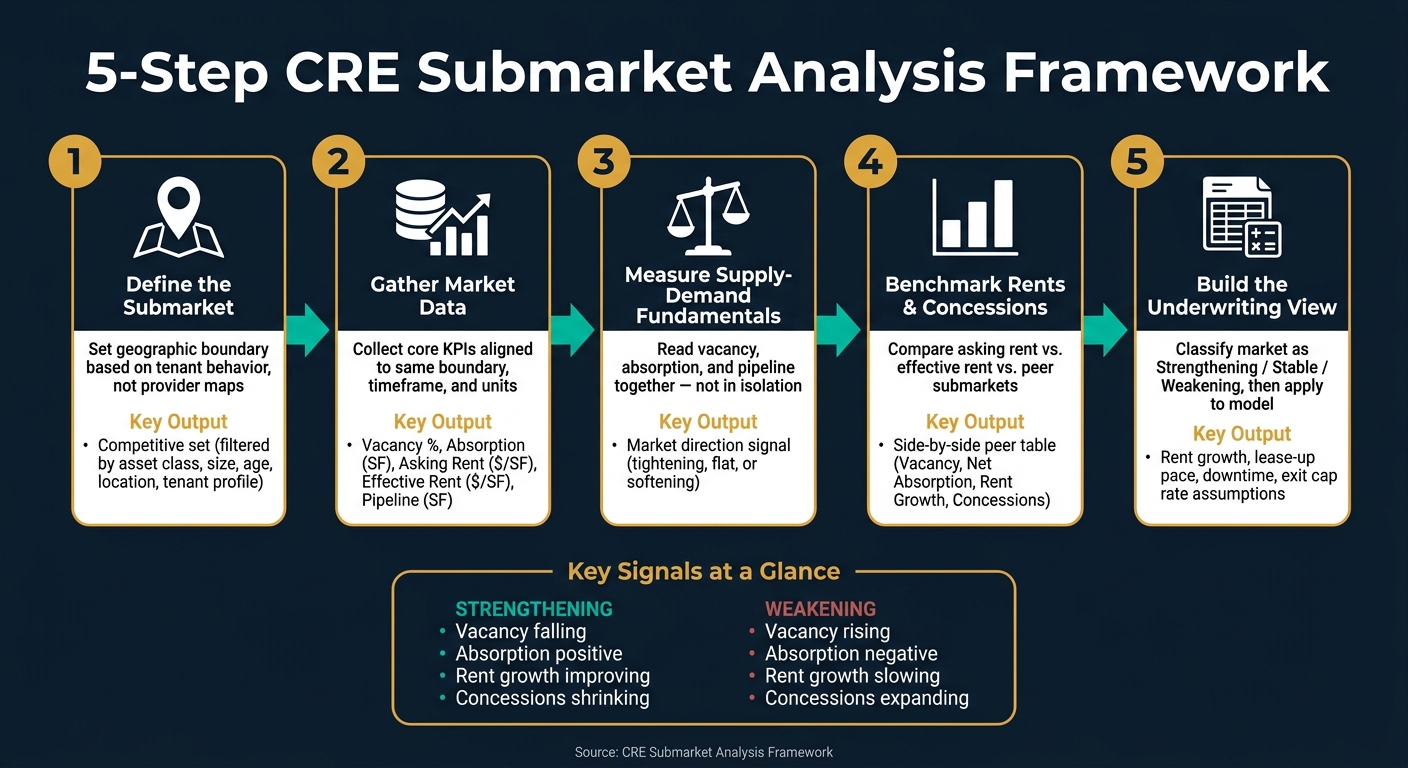
5-Step CRE Submarket Analysis Framework
Step 1: Define the Submarket and Competitive Set
Start by setting the market boundary and the competitive set. If this part is off, every number that comes after it rests on weak ground.
Set the Right Geographic Boundary
Define the submarket based on how tenants look for space, not on a provider's map. The focus should be on tenant demand, access, and how nearby properties compete for the same deals.
Metro-level data often blurs the gap between buildings that are close on a map but very different in practice. Tighten the scope to the area where the subject property faces its actual competition. After that, narrow the peer group to the properties that directly compete with it.
Choose Comparable Properties and Filter Out Noise
Build the competitive set around the factors that shape tenant choice. The main filters are:
- Asset class
- Property type
- Size
- Age
- Location
- Tenant profile
Outliers can distort vacancy and rent benchmarks and make the underwriting case less convincing. So be strict with your filters, and write down why each exclusion was made. Lenders and investors will ask.
Give more weight to comparables from the last 90 days. Market conditions can change faster than data providers refresh their records, and old comps can quietly throw off your benchmarks. Cross-check public records, MLS, and online databases. The goal is simple: use a competitive set that mirrors the nearby options a tenant would actually compare side by side.
This peer set becomes the baseline for Step 2's market data collection.
sbb-itb-df8a938
Step 2: Gather Market Data and Local Inputs
Once the Step 1 boundary and comp set are locked in, gather only the market data you need to compare that submarket cleanly. This is the point where an analysis either stays sharp or starts to drift.
Collect the Core KPIs
The KPIs that matter most in submarket analysis fall into three groups: market fundamentals, revenue and pricing, and supply pipeline. Each one answers a different question.
| KPI Category | Core Metrics | Standard Units |
|---|---|---|
| Market Fundamentals | Vacancy, Absorption, Occupancy | Percentage (%), Square Feet (SF) |
| Revenue/Pricing | Asking Rent, Effective Rent, Rent Growth | $/SF, Percentage (%) |
| Supply Pipeline | Under Construction, Deliveries | Square Feet (SF), Units |
Then add the local demand drivers that explain the numbers. These are the context pieces - employment trends, population shifts, infrastructure changes - that help explain what's pushing vacancy, rent, and absorption inside the boundary you've already set.
Use Data Sources You Can Defend in Underwriting
Every data point needs a clear, citable source. Broker reports, public records, property-level comps, and direct on-the-ground intel are some of the best inputs to use in underwriting. Broker calls can help surface issues early, but they shouldn't stand on their own. Use them to spot a lead, then confirm it with source data.
Before you compare anything, line up each source to the same boundary, timeframe, and unit. If one report covers a larger trade area and another looks only at your submarket, you're not making a clean comparison.
Align Timeframes and Units Before Analysis
Standardize timeframes, property definitions, boundaries, and units before you start comparing sources. Keep rents in $/SF, space in SF, rates in percentages, and dates in MM/DD/YYYY.
This may sound small, but it's where a lot of work goes sideways. A rent figure in annual $/SF next to a monthly rate, or a vacancy stat pulled from a different period, can throw off the whole read.
These inputs set up the supply-demand read in Step 3.
Step 3: Measure Supply-Demand Fundamentals
Use the standardized KPIs from Step 2 to figure out whether the submarket is tightening, holding steady, or softening. This is your first real check on whether the submarket lines up with your underwriting assumptions.
Read Vacancy, Availability, and Absorption Together
No single metric tells the whole story. Vacancy, availability, and net absorption each show a different part of the market, so you need to read them together to understand what’s going on. Then use the demand drivers from Step 2 to explain why those numbers are moving.
Assess the Construction Pipeline and Delivery Risk
Strong current fundamentals can change fast when new space hits the market. Measure the square footage under construction and the expected delivery dates within the defined submarket. Track the pipeline using the same boundary and timeframe so your read stays consistent.
Separate Structural Trends From Short-Term Noise
Compare more than one period to filter out short-term noise from a lasting shift in demand.
Use that read to check whether rents and concessions in Step 4 point in the same direction.
Step 4: Evaluate Rent, Pricing, and Relative Positioning
Now turn your Step 3 supply-demand read into pricing. The goal is to see what the market actually pays, not just what landlords post. When market conditions get tighter, pricing power usually shows up first in rent and concessions.
Compare Asking Rent, Effective Rent, and Concessions
Asking rent is the sticker price. Effective rent is the actual deal once you factor in concessions, TI, and lease structure differences like gross and NNN.
Benchmark the Subject Against Nearby Peers
Once you standardize the pricing metrics, compare the subject property with nearby peers using the same set of numbers.
Use one side-by-side table with matching metrics for each peer:
| Metric | Subject Submarket | Peer Submarket A | Peer Submarket B |
|---|---|---|---|
| Vacancy Rate | 8.5% | 6.2% | 10.1% |
| Net Absorption (SF) | 150,000 | 210,000 | (45,000) |
| Avg. Asking Rent | $32.00 | $35.50 | $29.00 |
| Avg. Effective Rent | $28.50 | $33.00 | $24.00 |
| Rent Growth (YoY) | 3.2% | 5.1% | 1.5% |
| Pipeline Volume (SF) | 500,000 | 1,200,000 | 150,000 |
| Concessions (Months) | 1.5 | 1.0 | 2.5 |
That side-by-side view shows whether the subject property is ahead of peers, roughly in line, or falling behind. It also gives you a clearer read on lease-up speed and your rent growth assumptions.
Carry that into Step 5 when you set revenue, exit, and reporting assumptions.
Step 5: Turn Submarket Data Into an Underwriting View
Once you've benchmarked rents and concessions, the next move is simple: turn that market read into an underwriting view. The point isn't to collect data for its own sake. It's to use that data to make a clear market call and then bake that call into your assumptions.
Classify Conditions as Strengthening, Stable, or Weakening
Before you change a single line in your model, describe the submarket in plain English. Is it strengthening, stable, or weakening? That one label gives the rest of the underwriting a clear anchor.
Use vacancy, net absorption, rent growth, concessions, and new supply together:
| Signal | Strengthening Signal | Weakening Signal |
|---|---|---|
| Vacancy | Falling | Rising |
| Net Absorption | Positive | Negative |
| Rent Growth | Improving | Slowing |
| Concessions | Shrinking | Expanding |
| New Supply | Leased quickly | Exceeds demand |
Stable means the signals are mixed, with no clear shift in vacancy, absorption, rents, or supply.
The key here is context. A single data point can mislead you. Rising supply, for example, isn't always a problem if absorption is keeping pace. On the flip side, rent growth can look fine on paper while concessions are quietly getting worse. That's why you need to read the signals together, not one by one.
After you've weighed those signals, convert the result into underwriting language you can use in investment memos, lender packages, and asset management updates.
Apply the Conclusion to Revenue, Exit, and Reporting Assumptions
Your submarket call should shape the model. If the market is getting better, your assumptions may lean stronger. If conditions are slipping, the model should show that too.
Tie the market call to revenue, exit, and reporting assumptions by tracking the drivers that matter most:
| Underwriting Variable | Submarket Driver to Monitor | Impact on Assumption |
|---|---|---|
| Market Rent Growth | Net absorption, vacancy, and competing supply | Stronger demand supports higher rent growth. |
| Lease-up Pace | Net absorption, construction pipeline | High pipeline and weak absorption slow lease-up. |
| Exit Cap Rate | Interest rates, recent comp sales | Rising rates can pressure exit caps higher. |
| Renewal Probability | Tenant financials, rent vs. market | Below-market rents increase renewal probability. |
| Downtime | Submarket vacancy, specific sector demand | High submarket vacancy increases projected downtime. |
This is where market research starts doing actual work inside the deal model. If vacancy is rising and supply is outpacing demand, you may need to temper rent growth, slow lease-up, and give more room for downtime. If demand is healthy and concessions are pulling back, that may support a firmer revenue view.
It also helps to build sensitivity toggles for rent growth and exit cap rates. That way, you can show stakeholders how changes in submarket conditions affect IRR. In practice, that turns the market section from a simple write-up into a tool for showing risk clearly.
Conclusion: The Core Steps to Analyze CRE Submarket Dynamics
A clean submarket analysis follows five steps: define the boundary and comp set, gather defensible data, measure fundamentals, benchmark peers, and convert the evidence into a market call that drives underwriting.
FAQs
How do I draw the right submarket boundary?
Move past static administrative zones like census tracts. They were built for population analysis, not for pricing homes.
Instead, use data-driven methods like grid cells or tessellation to spot what’s happening at the local level. That makes it easier to pick up signals such as transit access, nearby amenities, and economic activity.
The goal is simple: build segments that feel consistent within each area and clearly different across areas.
For broad classification, use crisp clustering. If you need to reflect in-between areas where one neighborhood blends into another, use fuzzy clustering instead. You can also layer in geospatial data, like mobility patterns and foot traffic, to get a sharper read on how each area actually functions.
What data sources are most reliable for underwriting?
Reliable underwriting gets better when you use more than one source.
Start with commercial real estate databases for property, rent, and vacancy data. Then layer in government sources like the U.S. Census Bureau and Bureau of Labor Statistics to review demographic and employment trends. Internal property records matter too, since they often fill in gaps that outside sources miss.
After that, cross-check what you find with public records and interviews with brokers or property managers. That extra step can help confirm transaction details and catch bad data before it affects the deal.
The Fractional Analyst and CoreCast can help streamline this process.
How often should I update submarket assumptions?
Update submarket assumptions on a regular basis. CRE markets can change fast, and stale data can lead to off-base valuations and missed risks.
The best approach is to stick to a set update schedule. In faster-moving markets, many experts tighten the data window to 3 to 6 months so projections stay in line with current conditions and help maintain stakeholder trust.