
Tenant Revenue Analysis: Key Metrics
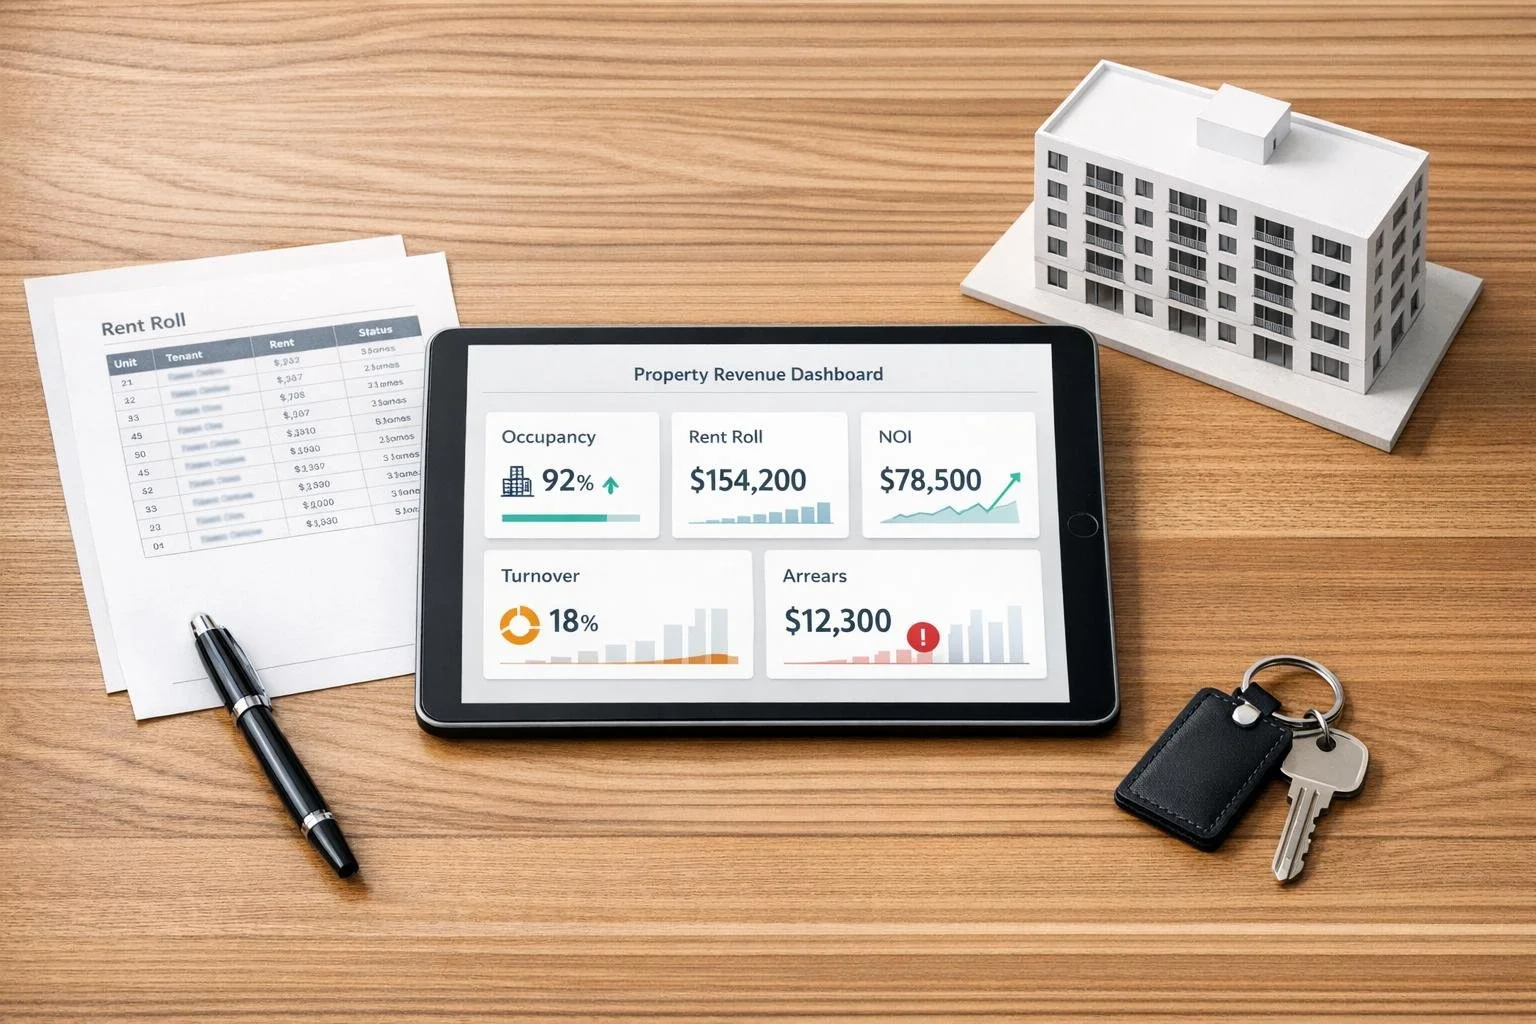
Tenant revenue analysis is all about understanding the financial performance of a property. By focusing on key metrics like occupancy rates, average rent per unit, and net operating income (NOI), property managers and investors can assess income stability, identify growth opportunities, and spot risks. Tools like rent roll reviews and tenant turnover rates also help uncover trends and areas for improvement.
Here’s a quick overview of the most important metrics:
- Occupancy Rate: Measures the percentage of leased units, directly impacting revenue stability. Healthy rates typically range from 95–96%.
- Average Rent per Unit: Tracks the average income per leased unit, helping compare performance with market benchmarks.
- Rent Roll Analysis: Provides a detailed view of rental income, lease terms, and tenant payment histories to identify below-market rents or lease expiration risks.
- Tenant Turnover Rate: Highlights how often units are vacated and re-leased, with associated costs ranging from $2,500 to $5,000 per turnover.
- Net Operating Income (NOI): Reflects profitability by subtracting operating expenses from gross rental income.
- Revenue Growth Rate: Tracks rental income changes over time, revealing trends and opportunities for rent increases.
- Tenant Sales per Square Foot (Retail): Evaluates retail tenant performance and their ability to sustain current rents.
- Arrears Collection Rate: Monitors overdue rent collection efficiency, directly impacting cash flow.
Modern tools like CoreCast simplify this process by automating calculations and centralizing data, saving time while improving accuracy. Metrics-driven insights are essential for making informed decisions during due diligence, managing properties effectively, and maximizing returns.
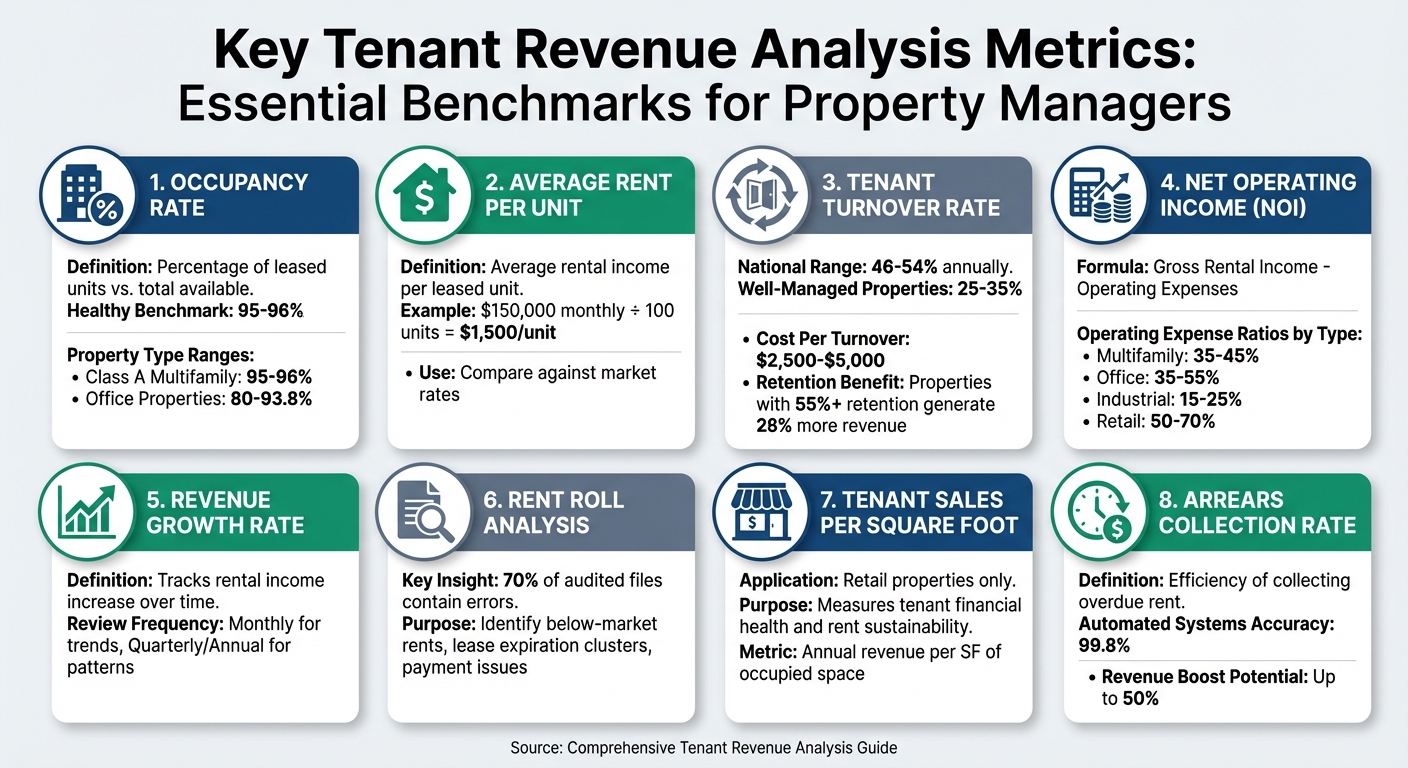
Key Tenant Revenue Analysis Metrics and Benchmarks for Property Managers
11 Key Performance Metrics Every Property Manager NEEDS to Track
sbb-itb-df8a938
Core Metrics for Tenant Revenue Analysis
Metrics play a vital role in turning tenant data into actionable insights about income, stability, and market performance. Below, we’ll break down the essential metrics that influence revenue performance.
Occupancy Rate
Occupancy rate measures the percentage of leased units compared to the total available units. This metric is crucial for assessing revenue stability since vacant units directly translate to lost income. In strong rental markets, occupancy rates typically hover around 95–96% [4].
To calculate it, divide the number of occupied units by the total number of units, then multiply by 100. For example, if a building has 100 units and 92 are leased, the occupancy rate is 92%. Benchmarks differ across property types: Class A multifamily properties usually report higher occupancy rates than office properties, which range between 80% and 93.8%.
Tracking this metric in real time allows property managers to address occupancy drops quickly and focus on lease renewals.
Average Rent per Unit
This metric calculates the average rental income generated per leased unit, offering a straightforward way to compare revenue potential with market rates. For instance, if a property earns $150,000 monthly from 100 occupied units, the average rent per unit is $1,500. If similar properties in the area charge $1,800 per unit, there’s a clear revenue gap. A detailed rent roll analysis can help uncover opportunities to close this gap.
Rent Roll Analysis
A rent roll is a comprehensive record of rental income, vacancies, and lease terms. It’s an essential tool for spotting payment issues and identifying revenue opportunities. By comparing current rental rates per square foot to market rates, property managers can identify units renting below market value and consider appropriate increases.
Rent rolls are also helpful for spotting lease expiration clusters - periods when multiple leases end at the same time. These clusters can create cash flow risks if tenants don’t renew. To ensure accuracy, reconcile the rent roll with profit and loss (P&L) statements and review tenant payment histories.
"In reality, around 70% of the files our auditors examined contained errors – from errors in accounting software to changes in 'cosmetic' capital improvements – reflecting the importance of adopting a proactive approach in lease expense reviews."
– Maria Nenciu, Forensic Lease Auditor, Cresa [4]
Additionally, verifying security deposits during property acquisition ensures the amounts held match the records, avoiding complications during ownership transitions.
Tenant Turnover Rate
Tenant turnover rate tracks how often units are vacated and re-leased over a specific period. Unlike the vacancy rate, which shows a snapshot of empty units, turnover rate highlights trends in tenant departures and the associated costs. Nationally, apartment turnover rates range between 46% and 54% annually, but well-managed properties in stable markets often achieve rates as low as 25–35% [6].
Turnover comes with significant costs, including cleaning, repairs, marketing, tenant screening, and lost rent - typically ranging from $2,500 to $5,000 per turnover [6]. Reducing turnover not only saves money but also strengthens revenue streams.
"Churn rate isn't just a management metric. It's a profitability lever that directly impacts cash flow, net operating income, and property valuation."
– REI Prime [6]
A real-world example: In 2025, a property owner in Columbus, Ohio, reduced the turnover rate of a 24-unit building from 54% to 25% by implementing a 90-day lease renewal outreach program, addressing deferred maintenance with an $18,000 investment, and offering $200 renewal bonuses. This effort reduced turnovers from 13 to 6, saving $22,400 in direct costs and recovering $15,750 in lost rent. The resulting improvement in net operating income (NOI) increased the property’s appraised value by $380,000 during refinancing [6].
Properties with retention rates above 55% can generate about 28% more revenue, as retaining tenants costs significantly less - around $200 - compared to over $1,000 for acquiring new ones [4].
Net Operating Income (NOI)
Net Operating Income reflects a property’s profitability after operating expenses but before debt payments. It’s calculated by subtracting operating expenses from gross rental income, excluding factors like mortgage payments, capital expenditures, and depreciation. This metric focuses solely on operational performance.
For example, if a property earns $500,000 in gross income and incurs $200,000 in operating expenses, the NOI is $300,000. Investors often use NOI to estimate a property’s market value by applying capitalization rates. Even a 1% increase in NOI can significantly boost a property’s value.
Operating expense ratios vary by property type:
- Multifamily properties: 35–45%
- Office properties: 35–55%
- Industrial properties: 15–25%
- Retail properties: 50–70% [4]
Understanding these benchmarks helps evaluate whether your expenses are in line with industry standards or require adjustments for better performance.
Additional Metrics for Deeper Analysis
These metrics go beyond the basics, offering a more detailed understanding of tenant performance. They provide a clearer picture of revenue trends and tenant financial health.
Revenue Growth Rate
This metric tracks the increase in rental income over a specific timeframe. It's calculated by comparing income from two different periods [7]. Factors like higher rental rates, reduced vacancies, strategic acquisitions, and better pricing strategies often drive growth [7].
"Tracking year-over-year rental income growth helps measure the performance of your properties and your ability to increase revenue over time."
– Jody Stowers, Owner and Broker, Stowers Real Estate [9]
Monthly reviews of this metric can reveal short-term trends, helping you make timely adjustments. For a bigger picture, quarterly or annual analyses can highlight longer-term patterns and the success of rent escalation strategies [9]. If growth stalls, consider offering incentives or adjusting rents to attract tenants willing to pay more [8]. For retail properties, pairing this data with sales per square foot metrics adds valuable context.
Tenant Sales per Square Foot (Retail Properties)
This metric is crucial for retail properties, measuring how much revenue a tenant generates annually per square foot of space they occupy [10]. It reflects a tenant's financial health and their ability to sustain current rent levels or absorb future increases.
"Tenant sales per square foot... is the total revenue a tenant earned in a year on a per square foot basis at a given location."
– Spencer Burton, Co-Founder and CEO, CRE Agents [10]
Higher sales per square foot often signal a tenant’s likelihood to renew their lease, reducing vacancy risks. This metric is especially important when evaluating percentage rent clauses, where the landlord’s income depends on tenant gross sales [10]. To assess rent sustainability, compare this measure with occupancy cost, which is calculated as total annual occupancy costs divided by annual gross sales.
"If the tenant's occupancy cost percentage is too high, they might vacate their space or require a reduction in their base rent or reimbursements in order to stay."
– Spencer Burton, Co-Founder and CEO, CRE Agents [10]
Anchor tenants deserve particular focus since their departure can significantly impact the overall retail center [10]. Lease agreements should require tenants to report gross sales annually, ensuring accurate performance monitoring and percentage rent calculations [10].
Arrears Collection Rate
This metric measures how effectively overdue rent payments are collected, providing insight into cash flow stability. Automated systems can achieve 99.8% accuracy, potentially boosting revenue realization by up to 50% [3].
Monitoring arrears collection rates monthly can help you spot trends in tenant payment behavior. Properties with strong collection systems tend to maintain healthier cash flows, reducing the risk of revenue shortfalls that could affect debt service coverage and property valuations.
Using CoreCast for Tenant Revenue Metrics
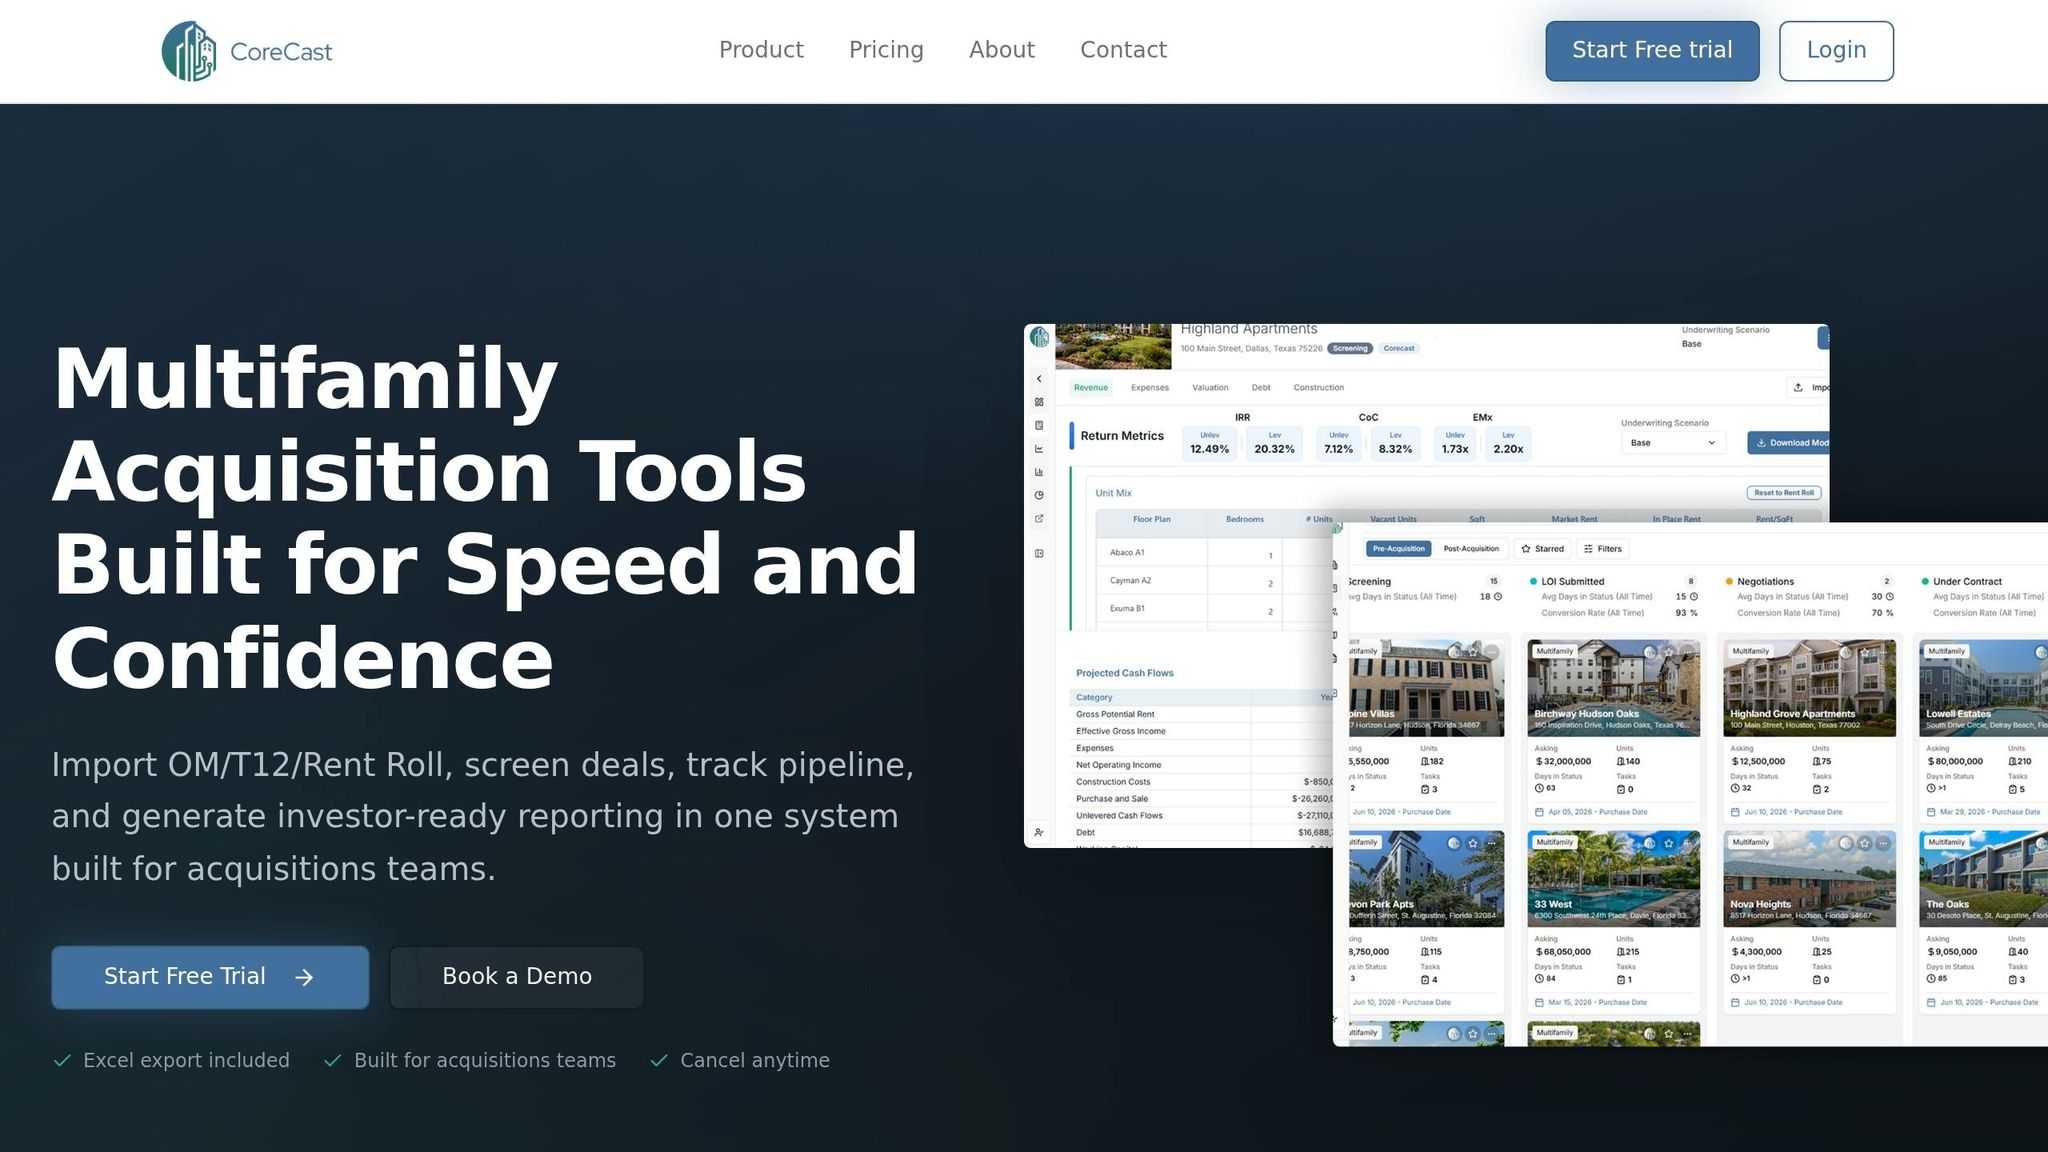
Manually analyzing tenant revenue metrics can be a time-consuming process. It often involves pulling data from multiple spreadsheets, management systems, and PDF reports. CoreCast simplifies this by centralizing and automating key calculations. With a drag-and-drop interface, you can upload Offering Memorandums, T12s, and Rent Rolls in both PDF and Excel formats. Its auto-extraction engine captures essential financial data points, reducing errors and saving time. This makes revenue analysis faster and more efficient, setting the stage for quicker decision-making.
CoreCast Features for Revenue Analysis
CoreCast offers a range of tools designed to make revenue analysis seamless:
- Underwriter Engine: This tool delivers unit-level projections, helping you understand how rent changes, vacancy assumptions, and renovations impact 10-year cash flow forecasts and IRR waterfalls. It also allows real-time tracking of occupancy rates, enabling immediate action on dips rather than waiting for monthly reports. Teams using real-time analytics tools report completing transactions 62% faster than those relying on traditional methods [12][14][15].
- Portfolio Insights Dashboard: This feature consolidates data from multiple properties into one view. It tracks Net Operating Income (NOI), cap rate trends, and lease expiry schedules across your portfolio. Built-in validation logic highlights inconsistencies - like unrealistic rent growth or missing data - before they reach stakeholders [3][12].
"CoreCast transformed how we communicate portfolio performance to stakeholders. We now spend more time analyzing data, and less time assembling it."
– Asset Manager, Mid-Market Private Equity Firm [12]
- Dynamic Lease Abstract Tool: This tool generates professional summaries from a centralized lease tracker, covering rent schedules, lease terms, and expenses. For retail properties, CoreCast integrates live rent comparables via Hello Data, allowing you to validate tenant revenue assumptions against nearby properties and recent sales. One REIT reported a 30% drop in deal slippage over two quarters after identifying bottlenecks in real time [1][3][12][15].
CoreCast doesn't stop at providing platform features - it also supports broader analytical needs with free financial models and tools.
Free Financial Models and Tools
In addition to its platform, CoreCast offers free downloadable Excel-based financial models through The Fractional Analyst. These models cover tenant revenue analysis for multifamily acquisitions, build-for-rent properties, and mixed-use developments. The Lease Abstract module, also free, generates professional summaries using a master lease tracker. It's especially useful for early-stage analysis before diving into more detailed tools [1][13].
"The financial models from The Fractional Analyst are top notch. I purchased the multifamily acquisition model and the mixed-use development model."
– Jason Glick, Principal, GPG Properties [1]
CoreCast pricing starts at $160/month for individuals (Solo plan), $400/month for small acquisition teams (Core plan), and $1,200/month for active platforms (Pro plan). Annual billing offers a 20% discount compared to monthly rates. A 7-day free trial is available, so you can test the platform with your own data before making a commitment [15].
Applying Metrics in Due Diligence
When it comes to due diligence, metrics are the foundation for understanding a property's financial health. Using a multifamily model can streamline this process. By combining core revenue metrics like occupancy rate, NOI, rent roll analysis, and turnover rates, you can create a clear picture of performance and risk. These metrics become even more insightful when compared against 3–6 similar properties, helping to account for differences in size, location, and condition [2].
For consistency, use U.S. formats: dollar amounts with commas (e.g., $2,750,000), rental rates in $/SF/year, and areas measured in square feet [3]. Operating Expense Ratios (OER) typically range between 45% and 55%. If the OER exceeds 57%, it may point to inefficiencies. For instance, a subject property with an OER of 62% might signal deferred maintenance, poor management, or unusual lease terms that need further investigation.
Creating a Metrics Comparison Table
A well-structured table can help identify performance gaps at a glance. Compare your subject property against similar properties using key metrics like lease structure, tenant credit quality, NOI, cap rate, and occupancy trends. This side-by-side analysis makes it easy to spot deviations and areas of concern.
| Metric Category | Key Metrics Included | Stakeholder Focus |
|---|---|---|
| Income Potential | NOI, Cap Rate, Rent Roll Analysis | All Investors |
| Lending Risk | DSCR, LTV, Debt Yield | Lenders, Banks |
| Long-term Return | IRR, Equity Multiple, Appreciation | Institutional Investors, PE Firms |
| Efficiency | OER, Vacancy Rate, Arrears Rate | Property Managers, Owners |
Variance analysis is crucial for explaining discrepancies. For example, if your projected vacancy rate was 5% but actual performance shows 12%, you need to pinpoint the cause. Is it due to market conditions, tenant turnover, or misaligned pricing? Sensitivity analysis can add depth by simulating changes - like a 1% rise in interest rates or a 10% drop in rental income - to assess how these shifts might impact performance [11].
Presenting Findings to Stakeholders
Different stakeholders care about different metrics. Institutional investors focus on IRR and NPV, while lenders prioritize rent rolls and DSCR. Private equity firms often look at equity multiples and value-add strategies [3]. To cater to these varying interests, tailor your presentation accordingly.
Keep executive summaries brief - around 5–10% of the total report. Start with the main opportunity, whether it’s a prime location, untapped value-add potential, or strong tenant quality. Use bullet points to present key data clearly, and wrap up with actionable next steps or timelines [3].
Visual aids are your ally here. Bar charts can illustrate occupancy trends, line graphs can show property value growth, and heat maps can highlight geographic performance [3].
"Investors want clarity not just on the numbers, but also on the story behind those numbers. They seek assurance that their investments are performing well compared to market benchmarks and that you're actively managing risks."
– Daniel Roccanti, Industry Expert [3]
Transparency is key. If tenant turnover rises sharply, explain whether it’s due to broader market trends or specific property issues - and outline your plan to address it. Being upfront builds trust. In fact, markets with high transparency attract 80% of global investment, amounting to about $1.2 trillion [3].
Conclusion
Knowing your tenant revenue metrics is key to making smarter decisions, safeguarding investments, and boosting returns. The metrics discussed - like occupancy rates, net operating income (NOI), rent roll analysis, turnover rates, and revenue growth - are the backbone of commercial real estate analysis. Add insights such as tenant sales per square foot and arrears collection rates, and you’ll have a much clearer picture of your property’s performance.
Fragmented data often leads to costly errors and overruns, highlighting the importance of automation. Platforms like CoreCast bring all your data together in one place, slashing document error rates from 10% to less than 1% and lowering operational costs by up to 20% [4].
Centralizing your data is just the start. Real-time analytics take property management to the next level, letting you move from reactive to proactive strategies. Instead of waiting for monthly reports, live dashboards now allow property managers to track NOI, occupancy, and lease renewals as they happen. This real-time approach helps you tackle problems - like rising tenant turnover or declining collection rates - before they grow. Automated reporting systems can also cut data compilation time by over 50% [5], giving your team more bandwidth for strategic planning.
For more advanced analysis, The Fractional Analyst offers financial services starting at $95 per hour, giving you access to top-tier financial analysts for tailored insights. Whether you prefer self-service tools or direct analyst support, turning raw data into actionable intelligence is essential for improving portfolio performance. Accurate tenant revenue analysis remains a cornerstone of thorough due diligence and long-term investment success.
FAQs
Which tenant revenue metrics matter most for my property type?
The most important tenant revenue metrics can vary depending on your property type, but a few stand out across the board. These typically include:
- Occupancy Rates: This measures how much of your property is currently leased, giving insight into vacancy levels and rental demand.
- Lease Renewal Rates: This indicates how many tenants are choosing to renew their leases, a critical factor for tenant retention and reducing turnover costs.
- Absorption Rates: This tracks how quickly available units are being leased, helping you gauge market demand and the effectiveness of your leasing strategy.
- Rent Trends: Monitoring rent increases or decreases over time provides a clear picture of income stability and market competitiveness.
Together, these metrics help you assess vacancy reduction, tenant retention, and overall financial health, offering a comprehensive view of your property's performance.
How do I validate a rent roll against the T12 and P&L?
To check a rent roll against the T12 and P&L, start by comparing the rental income figures. The rent roll's income should match the income reported in the T12 and P&L. Make sure the rent roll reflects the T12's 12-month income data and accurately represents current lease agreements. Double-check that lease terms, rent amounts, and occupancy rates are consistent across all documents. This ensures the data is reliable for due diligence or underwriting purposes.
How can I use NOI, turnover, and arrears to identify risks early?
Keep an eye on NOI (Net Operating Income) to gauge profitability - if it drops, it could mean expenses are climbing or income is shrinking. Pay attention to tenant turnover, as high turnover rates might hint at potential vacancy issues. Regularly check arrears, which are overdue payments; a rise in arrears could signal financial difficulties among tenants. By monitoring these metrics together, you can catch early signs of financial or occupancy challenges and address them promptly.