
How Tiered Waterfall Sensitivity Impacts Investor Returns

A deal can produce the same cash flow and still give LPs and GPs very different returns. The reason is simple: the waterfall decides who gets paid first, when the split changes, and how much upside moves to the GP once hurdles are hit.
If I had to boil this down fast, here’s the takeaway:
- Higher preferred returns usually keep more profit with the LP.
- Catch-up tiers can shift cash to the GP right after the pref is met.
- IRR-based hurdles can turn on upper tiers from timing alone, even if total profit is not much higher.
- Exit cap rate and hold period often decide whether a deal stays in a 70/30 split or moves to 60/40 or 50/50.
- In the example, moving the exit cap from 6.0% to 5.0% changed deal IRR from 14.23% to 17.99%, which changed the split tier too.
This means you should not judge a deal by property assumptions alone. You also need to test the waterfall itself: pref rate, catch-up, promote tiers, hurdle type, exit timing, and exit value.
IRR Hurdle Waterfall Template with GP Catch-up Provision
sbb-itb-df8a938
Quick Comparison
| Item | What it changes | What to watch |
|---|---|---|
| Preferred return | Delays GP promote | Higher pref often supports LP returns |
| Catch-up | Sends post-pref cash to GP | Can lower LP share faster than expected |
| Promote split | Changes upside sharing | Upper tiers can move from 70/30 to 50/50 |
| IRR hurdle | Uses timing of cash flows | Shorter holds or refis can trip tiers |
| Equity multiple hurdle | Uses total dollars returned | Less sensitive to exact timing |
| Exit cap rate | Changes sale value and deal IRR | Even 0.25% to 0.50% can swing results a lot |
| Hold period | Changes whether hurdles are hit | A 5-year hold may clear a tier a 7-year hold does not |
Put another way: waterfall terms can change investor outcomes just as much as property performance assumptions. That’s why I’d model the deal monthly, use XIRR, track unpaid pref, and test edge cases before trusting the projected split.
Tiered Waterfall Structures and the Variables That Drive Return Shifts
Preferred Return, Return of Capital, Catch-Up, and Residual Splits
Tiered waterfalls usually move through four steps.
Return of capital comes first. LP and GP capital is paid back pro rata until the initial equity is fully repaid [1][2].
Preferred return comes next. LPs often receive a 7% to 9% preferred return on unreturned capital before the GP starts earning promote [1][2].
After the pref, a GP catch-up may send most or all cash to the GP until the agreed promote share has been met [1][2].
Then come residual splits. At that stage, the remaining profits are divided, and common setups run from 80/20 to 60/40 (LP/GP). The GP share usually climbs once performance clears higher hurdles [1][2].
| Waterfall Component | Typical U.S. Market Range | Effect on Distributions |
|---|---|---|
| Preferred Return | 7%–9% annualized | Prioritizes LP cash flow; delays GP promote |
| GP Catch-Up | 100% to GP until caught up | Rapidly reallocates cash to GP after LP hits pref |
| Promote Tiers | 20%–40% to GP | Increases GP share as performance exceeds hurdles |
| Residual Split | 60/40 to 80/20 (LP/GP) | Determines final profit sharing at exit |
Once you understand the split mechanics, the next job is simple: test the inputs that change who gets paid, when they get paid, and how much they get.
IRR Hurdles vs. Equity Multiple Hurdles
The trigger matters just as much as the tier itself. In most deals, tier changes are driven by IRR hurdles or equity multiple hurdles.
| Hurdle Type | Trigger Logic | Strengths | Weaknesses | Alignment Impact |
|---|---|---|---|---|
| IRR Hurdle | Time-weighted; based on speed of capital return | Rewards efficiency; incentivizes early exits | Sensitive to exact dates; can be distorted by refi events | High alignment for value-add and opportunistic deals |
| Equity Multiple | Absolute; total cash returned vs. invested | Ensures a minimum dollar profit before GP is rewarded | Ignores time value of money; can favor slower capital recycling | Better for stabilized, long-hold deals |
IRR hurdles measure how fast capital comes back. That tends to reward sponsors who return cash early and push toward efficient exits. But there's a catch: early refinance proceeds can lift IRR without adding much total profit [1][2].
Equity multiple hurdles look at absolute dollar return instead. The formula is straightforward: total cash distributed divided by initial equity, no matter how long it took [1][2].
Put plainly, IRR hurdles tend to favor faster exits, while equity multiple hurdles favor total profit.
Which Waterfall Inputs to Stress-Test
When you stress-test a waterfall, don't look at hurdle levels in isolation. Test hurdles, promote splits, and hold period together, because any one of them can decide whether the upper tiers ever turn on.
- Higher hurdles delay GP promote and protect LP economics
- Wider promote splits increase GP participation after hurdles are cleared
- Longer holds make upper-tier activation more likely
Those inputs shape whether upper tiers activate at all, which is exactly why they drive the case study results below.
How to Test Waterfall Sensitivity
Once you’ve identified the main waterfall drivers, the next move is to test them in a clean, controlled model.
Base Case Assumptions and Model Setup
Start by locking the deal structure. The goal is simple: keep property performance the same so the only thing changing is the waterfall, and that lets you see how each term shifts the LP/GP split.
Your base case should use a $5,000,000 total equity raise with a 90/10 LP/GP contribution split, fixed operating assumptions like 3% rent growth and 5% vacancy, 70% LTV at a 6% interest rate, and a planned five-year hold with a 5.5% exit cap rate. The waterfall should begin with an 8% preferred return and a 70/30 LP/GP residual split [1]. Lock those inputs so only waterfall terms affect returns.
Model cash flows monthly and use XIRR so you don’t run into preferred return accrual mistakes from uneven distributions [1]. And when you convert the annual pref to a monthly pref rate, use (1 + rate)^(1/12) - 1 instead of rate/12 [1]. That small formula choice can make a big difference.
Sensitivity Matrix Design
Now test the terms that change when LPs and GPs get paid, and how much each side gets. The cleanest way to do this is to test each input by itself first, then layer them together.
The main variables to isolate are:
- Hurdle rates to test how fast promote tiers turn on
- Catch-up provisions to see how an interim tier changes GP sharing after the pref is paid
- Promote splits to isolate how economics shift between LPs and GPs
- Exit timing to show whether upper tiers get hit at all
- Exit cap rate to measure how much the exit assumption moves the result
A practical hurdle-rate stress test includes 12%, 15%, and 18% IRR thresholds, while exit cap rate sensitivity of ±0.25% to 0.50% can move IRR by 300+ basis points [1].
Model catch-up as its own tier that starts after the pref is paid and runs until the GP reaches the agreed share [1][2]. If you test catch-up terms on their own, it becomes much easier to see what they’re doing to LP and GP economics.
Modeling Controls and Audit Checks
This part is your gut check. You want to confirm that the result is coming from tier changes, not from a broken model.
Reconcile cash in and cash out every period so distributable cash always equals total LP and GP distributions [1]. Then split each tier into its own model section: return of capital, pref, catch-up, and residual split [1]. That makes the logic easier to follow and a lot easier to audit.
Use MIN() to cap each distribution at available cash, and keep a running pref accrual balance so you can verify that the pref is fully paid before any promote tier starts [1].
It also helps to test edge cases where returns barely clear a hurdle. Those are the spots where model mistakes tend to hide.
Once those checks hold up, you can compare how each tier changes LP and GP returns under the exact same deal assumptions.
Case Study Findings: How Tier Changes Reallocate Returns
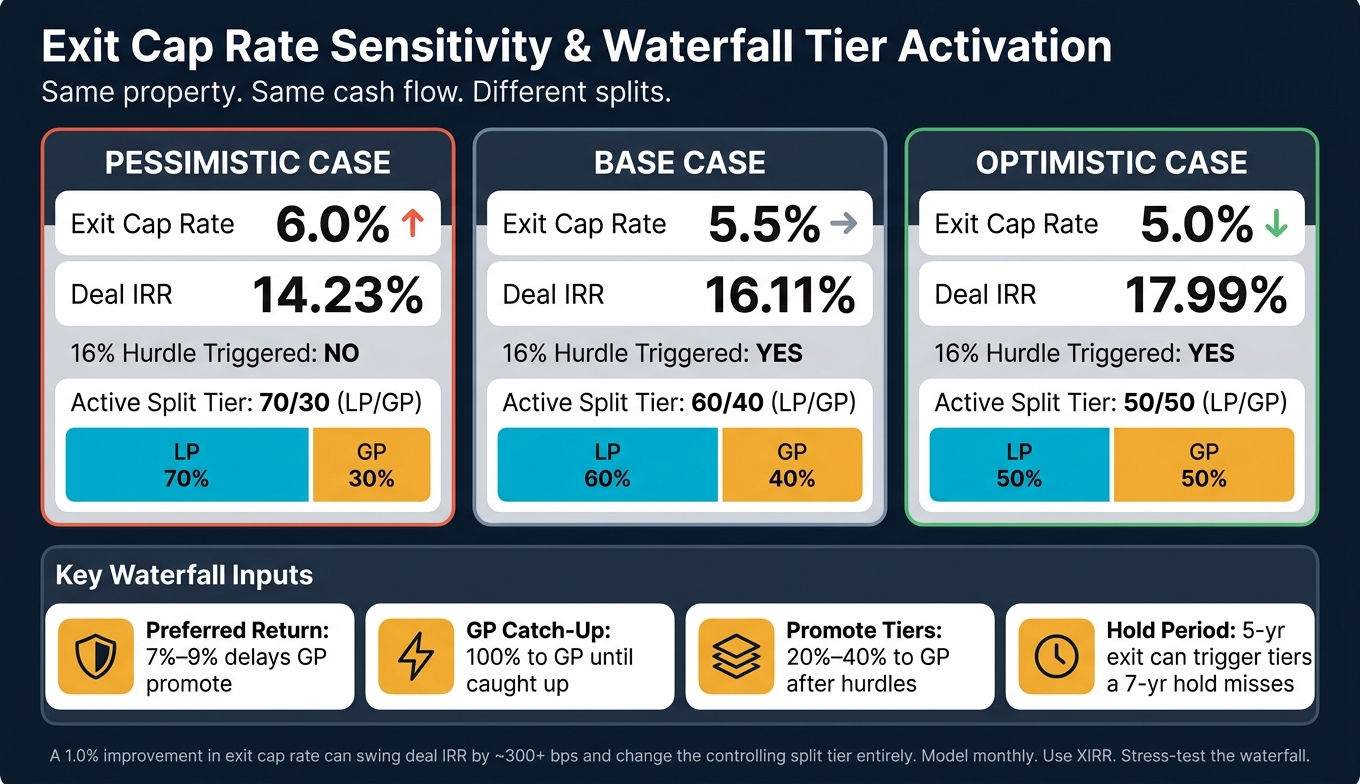
Tiered Waterfall Structures: How Exit Cap Rate & Hurdles Shift LP vs. GP Returns
In the case study, tier changes reallocated returns even though property cash flow stayed the same. Using the base-case model, the sensitivity runs show how changing the waterfall can shift the same pool of cash between the LP and GP. The scenarios below adjust several waterfall terms at once, so you can see how the structure changes each party’s economics. Here, LP IRR went down, GP promote dollars went up, and the key swing factor was whether the upper tier turned on.
Higher Hurdles Generally Protect LP Economics
Moving the preferred return from 8% to 10% gives the LP a larger total share of profits, even when the property performs the same way [1]. Put simply, a higher first hurdle makes it harder for the GP to reach the richer promote tiers.
The comparison below shows the difference between a moderate setup and a more GP-heavy one:
| Waterfall Component | Moderate Structure | Aggressive GP Structure |
|---|---|---|
| Preferred Return (First Hurdle) | 8% IRR | 10% IRR |
| Promote Split - Tier 1 | 80/20 (LP/GP) | 70/30 (LP/GP) |
| Promote Split - Tier 2 | 70/30 (LP/GP) | 50/50 (LP/GP) |
| Catch-Up Provision | None | GP receives 100% until the catch-up is met |
In the aggressive structure, the catch-up provision gives the GP 100% of distributions until the catch-up is met. That pushes profits to the GP faster once the LP pref has been paid.
Aggressive Promote Tiers Can Cut LP IRR Faster Than Expected
Shifting the upper tier from 70/30 to a 50/50 split sends more upside to the GP after the hurdle is cleared. That can hit LP IRR faster than many people expect.
Why? Because a small bump in exit value can push the deal into the next tier. Once that happens, the split on the incremental gain changes. The LP may still get more dollars overall, but its share of the upside gets smaller.
Exit Timing and Valuation Often Determine Whether Upper Tiers Activate
Exit cap rate and hold period often decide whether an upper tier activates. The same pattern shows up when valuation changes are big enough to move the deal into a new tier. In the case study, moving from a 6.0% exit cap rate to a 5.0% exit cap rate pushed deal IRR from 14.23% to 17.99%. That changed not just how much the deal earned, but which tier controlled the split.
| Exit Scenario | Exit Cap Rate | Deal IRR | 16% Hurdle Triggered? |
|---|---|---|---|
| Pessimistic Case | 6.0% | 14.23% | No - Remains in 70/30 tier |
| Base Case | 5.5% | 16.11% | Yes - Enters 60/40 tier |
| Optimistic Case | 5.0% | 17.99% | Yes - Enters 50/50 tier |
A 5-year exit can trigger higher promote tiers that a 7-year exit may not. The reason is simple: the shorter hold can push deal IRR over the hurdle even when total dollar profit is lower. That’s one of the quirks of IRR-based waterfalls. A deal can earn less cash in total and still move into a richer GP split because the return shows up sooner.
That’s why sponsors and LPs should stress-test exit timing and valuation cases before they lock the waterfall. A structure can look fine in the base case, then behave very differently once the exit shifts by just a little.
These activation points shape how sponsors should structure and report the waterfall.
Practical Steps for Structuring, Reporting, and Investor Communication
How Sponsors and Investors Can Use These Findings
These sensitivity results matter most during negotiations, not after the deal is already signed.
A headline split can hide very different LP/GP outcomes. On paper, a 70/30 split may look identical across two term sheets. But if one deal includes a catch-up provision and a lower first hurdle, the LP outcome can shift a lot. That’s why sponsors and LPs should test alignment with sensitivity tables, not just base-case projections. Exit assumptions can change who ends up taking more of the upside.
Where Better Modeling Support Adds Value
That means reporting discipline matters just as much as the economics on the page.
Small waterfall modeling mistakes can snowball fast. The practical guardrails are monthly modeling with XIRR, cash-balance reconciliation in each period, and clear tier separation so the promote logic is easy to audit [1].
The Fractional Analyst provides underwriting, reporting, and model support for sponsors managing complex waterfall structures and investor reporting requirements.
Key Takeaways
Taken together, the case study points to three practical actions for underwriting and investor reporting:
- Stress-test hurdle design and promote ladders under multiple exit cap rate and hold period assumptions before terms are final.
- Report capital accounts, preferred return accruals, and tier activation with clarity - not just total distributions.
- Use monthly modeling and cash-balance reconciliation to keep distribution calculations tied to actual cash availability [1].
The waterfall is the cash-allocation mechanism. It deserves the same level of care applied to underwriting assumptions so sponsors and investors can line up on the economics before the deal closes.
FAQs
What is a catch-up tier?
A catch-up tier is a temporary part of a real estate waterfall. It lets the General Partner (GP) take a larger share of profits after the Limited Partners (LPs) have received their preferred return.
This step stays in place until the GP’s share matches the agreed promote split. In plain English, it helps even out the distribution of profits. Once that target percentage is met, the catch-up tier stops.
Why can a shorter hold boost GP promote?
A shorter hold can boost GP promote by increasing the project’s IRR. That matters because promote structures are often tied to IRR hurdles. If the IRR goes up over a shorter stretch, the GP may hit those benchmarks sooner.
When an asset performs well in a shorter window, cash comes back faster. That can trigger the promote tier earlier and increase the GP’s share of profits compared with how long the capital was in the deal.
How should LPs stress-test a waterfall?
LPs should run sensitivity analyses on the main drivers behind return hurdles, including rental income growth, vacancy, operating expenses, and exit cap rates. This gives you a clearer view of how shifts in performance can change promote distributions.
It helps to test both upside and downside cases. An optimistic case can show how the waterfall behaves when income grows faster or the exit looks stronger. A pessimistic case can show what happens when vacancy rises, expenses climb, or pricing at sale weakens. That side-by-side view makes the model much easier to trust.
For a deeper read, use Monte Carlo simulations and push the model with extreme inputs, such as very high IRRs or negative cash flow. If the waterfall still works under that kind of stress, you know it can handle more than just the neat, expected case.