
Ultimate Guide to Discount Rates in DCF

A discount rate can change a CRE valuation fast: on a 10-year hold, a 0.50% move can shift value by roughly 4% to 6%.
If I had to boil this article down to a few points, I’d say this:
- The discount rate is your required return, and I use it to turn future cash flow into today’s value.
- It is not the same as cap rate or IRR. Cap rate is a one-year yield snapshot. IRR is the return the model produces.
- The rate has to match the cash flow. Unlevered cash flow needs an asset-level rate. Levered cash flow needs a higher equity-level rate.
- I should build the rate instead of guessing it, usually from the 10-year U.S. Treasury, then adding asset and deal risk.
- I should test it with the exit cap rate, because reversion often makes up a big share of total value.
- A two-way sensitivity table is a must, since small input changes can move value by millions of dollars.
Here’s the short version: if I pick the wrong discount rate, the DCF can look precise while the value is off. The fix is simple: build the rate, match it to the cash flow, and test it against exit assumptions and market pricing.
| Item | What it does |
|---|---|
| Discount Rate | Input used to discount future cash flows |
| Cap Rate | Year 1 NOI ÷ purchase price |
| IRR | Return generated by the modeled cash flows |
That’s the core idea behind the full article.
Discounted Cash Flow (DCF) Model Explained
sbb-itb-df8a938
Core Concepts and Mechanics
Once you’ve set the discount rate, the next job is to build it the right way and apply it to the right cash flow stream using professional analytical tools.
Required Return, Hurdle Rate, and Risk Premium
The discount rate is the investor’s required return. The hurdle rate is the minimum return a deal needs to clear. In practice, the required return becomes the rate you use in the model.
The risk premium is the extra return above the risk-free rate. A simple buildup starts with the 10-year U.S. Treasury yield, adds an asset-class premium of 100 to 400 bps, and then adjusts about ±100 bps for property-specific risk [1]. If a deal has more execution risk, that adjustment should be higher.
The main discipline here is simple: document the buildup instead of picking a neat round number. When you show the exact premiums you added, the rate is much easier to defend in front of an investment committee.
Present Value Formula and Terminal Value Treatment
Discount each cash flow by dividing it by (1 + r)^t. Apply that same approach to terminal value, or reversion, at exit. Every cash flow gets discounted back to present value using the same rate, applied the same way across the hold period.
On a standard 10-year hold, a 50 bps shift in the discount rate can move total DCF value by 4% to 6% [1].
That math only holds up when the discount rate matches the cash flows you’re discounting.
Matching the Rate to Unlevered and Levered Cash Flows
The rate and the cash flow type have to line up. If they don’t, the model gets shaky fast.
| Cash Flow Type | What It Includes | Discount Rate to Use | Typical Range |
|---|---|---|---|
| Unlevered (Asset-Level) | NOI less CapEx | Asset-level discount rate | 7% – 11% [1] |
| Levered (Equity-Level) | Cash flow after debt service | Equity discount rate | 12% – 20% [1] |
An unlevered DCF values the property apart from financing. A levered DCF discounts the cash flow that reaches equity after debt service, so it needs a higher rate to reflect the added financial risk.
Mix those up, and the valuation gets distorted while risk looks lower than it is [1]. With the rate matched to the cash flow type, the next move is picking a market-based input you can defend. These mechanics are the base for choosing a market rate that holds up under review.
How to Select a Discount Rate in Practice
No single discount rate works for every deal. The right rate should match the asset's risk, the business plan, and what the market is pricing right now. And one rule matters more than anything else: match the rate-selection method to the type of cash flow you're discounting.
Market-Based, Build-Up, and Investor-Return Methods
In U.S. CRE underwriting, three methods show up again and again. Each one helps, but each does a different job.
The market-based method starts with transaction evidence, meaning recent comparable sales. It ties your rate to what buyers are accepting in the current market. That's a big plus when you have recent, relevant comps instead of old or shaky data.
The build-up method lays out each premium that pushes the final rate higher. It gives you a clear paper trail for why the rate ended up where it did. A typical build-up looks like this:
| Build-Up Component | Typical Adjustment |
|---|---|
| Risk-Free Rate | 10-Year Treasury Yield |
| Asset-Class Premium | +100 to +400 bps [1] |
| Property-Specific Risk | +/- 100 bps [1] |
| Execution/Strategy Risk | +50 to +200 bps [1] |
The investor-return method works in reverse. You begin with the equity return target required by the strategy or capital partner, then back into the discount rate from there. This is useful when you're underwriting to a set hurdle rate or IRR target.
In practice, it's smart to use all three and triangulate a defensible range. Sometimes the market-based method should lead. Other times, the investor's required return is the main guardrail. It depends on how much market evidence you have and whether the return target is already fixed.
Adjusting for Property Type, Strategy, and Market Conditions
Once you've picked a method, the next step is adjusting the rate for asset quality, the business plan, and the market cycle. As lease rollover, tenant risk, and execution risk go up, discount rates usually go up too.
Lease profile matters. A property with a long weighted average lease term (WALT) and strong-credit tenants will often support a lower discount rate. On the other hand, a deal with heavy near-term rollover needs a higher rate because downtime and tenant improvement costs add more risk. Put simply: the strength of the income stream matters just as much as the dollar amount.
Strategy matters just as much as property type. As you move from stabilized core to value-add, opportunistic, and development, the required rate usually climbs. That's not surprising. The more moving parts in the plan, the more room there is for things to go sideways.
Capital markets set the floor. Higher Treasury yields push the baseline higher. And local factors often matter more than national averages, especially job growth, submarket liquidity, and historical pricing.
Discount Rate Benchmarks by CRE Risk Category
Benchmarks are a gut check, not a substitute for judgment. They help you see whether your rate looks in line with the deal you're underwriting.
| Risk Category | Unlevered Range | Levered Range |
|---|---|---|
| Stabilized Core | 7% – 11% [1] | 10% – 14% [1] |
| Value-Add | 8% – 12% [1] | 12% – 18% [1] |
| Opportunistic / Development | 10% – 15%+ [1] | 15% – 20%+ [1] |
The gap between unlevered and levered rates reflects the extra risk equity investors take on after debt service. As you move up the risk ladder, both rates tend to widen to account for more uncertainty.
Applying the Discount Rate and Testing the Output
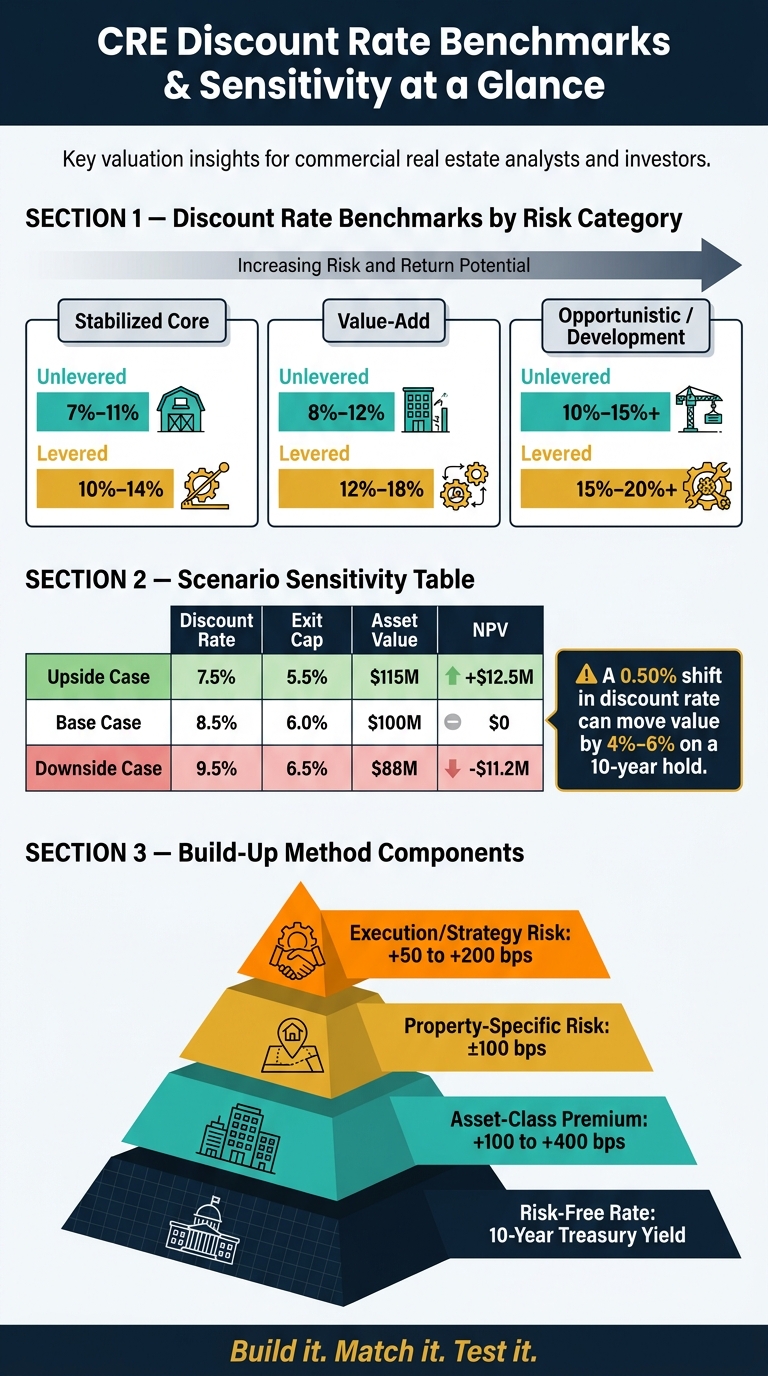
CRE Discount Rate Benchmarks by Risk Category: Unlevered vs. Levered
Once the discount rate is set, the next step is simple: see if the valuation still works under your exit assumptions.
Applying the Rate to Cash Flows, Reversion, and NPV
After you choose a discount rate, apply it to each year’s net cash flow. Use the rate that matches the cash flow stream:
- Discount unlevered cash flow before debt service with an unlevered rate
- Discount levered cash flow after debt service with a levered rate
The terminal value, or reversion, gets discounted too. It’s usually calculated by dividing Year 11 NOI by a projected exit cap rate and then subtracting selling costs. In a 10-year hold, reversion often drives most of total value [1]. That’s why even a small miss on the exit cap rate or discount rate can move value fast.
Add the discounted cash flows to the discounted reversion, and you get total asset value. From there, compare that value to the purchase price to calculate NPV. If NPV is positive, the deal clears the hurdle.
Because reversion makes up such a big part of value, don’t stop at checking the annual cash flow. Test the discount rate against the exit cap assumptions too.
Sensitivity Analysis and Scenario Tables
A single-point valuation can make a deal look cleaner than it is. But CRE models don’t live in a neat little world.
The discount rate is one of the most sensitive inputs in the model: a 25 bps change in the terminal cap rate can shift value by 4% to 5% [1]. For that reason, a two-way sensitivity table, where you change both the discount rate and the exit cap rate at the same time, is a standard part of CRE model review [1].
Here’s how those two inputs can interact across three scenarios:
| Scenario | Discount Rate | Exit Cap Rate | Resulting Asset Value | NPV (at Target) |
|---|---|---|---|---|
| Upside Case | 7.5% | 5.5% | $115,000,000 | +$12.5M |
| Base Case | 8.5% | 6.0% | $100,000,000 | $0 |
| Downside Case | 9.5% | 6.5% | $88,000,000 | -$11.2M |
Use heatmap formatting to show break-even points and downside cushion.
The last check is internal consistency.
Reconciling to Exit Cap Rate and Investment Thesis
After the sensitivity table is done, make sure the discount rate and exit cap rate tell the same story. One common mistake is pairing a low, aggressive exit cap rate with an optimistic discount rate. That stacks optimism on top of optimism, and it usually doesn’t make it through committee review.
A good guardrail is to set the terminal cap rate 25 to 50 bps above the going-in cap rate [1]. The property will be 10 years older when it sells, and buyers will price that in. If your model assumes the exit cap compresses, or even stays flat, without a clear value-add reason, that’s a red flag.
Also cross-check the DCF output against recent sales comparables [1]. If your model spits out a value that sits well above where similar assets are trading, it’s time to revisit the discount rate, the exit cap rate, or both before the deal moves forward.
Conclusion: Building Defensible Discount Rates for CRE DCF Models
Start with a risk-free base. Then add documented premiums for asset class risk and deal-specific risk. That gives you a rate you can explain instead of one you just picked.
After that, check fit. The discount rate needs to line up with the cash flow stream in the model. Unlevered asset cash flows call for lower rates than levered equity cash flows. If those don’t match, the output can get off track fast.
Then test the assumption. A two-way sensitivity table helps show how much value can swing when the discount rate moves even a little. On a standard 10-year hold, small changes in the discount rate can shift value by 4%–6% [1]. That table should be in every investment committee memo.
The working rule is simple: build it, match it, and test it.
Key Takeaways for Analysts, Investors, and Portfolio Managers
The discount rate runs through the whole deal. It affects acquisitions, underwriting, asset management, and investor reporting. In each of those areas, a few habits make the work tighter and easier to defend.
- Document the build-up. Don’t choose a rate without writing down the risk-free rate and each premium added on top. When market conditions change, that record shows how the assumption was built.
- Reconcile the rate to the exit. Line up the exit cap rate with the property’s age and the business plan. If the model assumes cap rate compression, that needs a clear and specific value-add reason behind it.
- Show a base case, a sensitivity table, and a downside case. The downside case should reflect a deal where the thesis only partly plays out. That gives stakeholders a more honest view of the range of outcomes [1].
FAQs
How do I choose a discount rate when comps are limited?
When market comps are thin, don't wing it. Use a buildup approach instead.
Start with a risk-free rate, such as the 10-year Treasury yield. Then layer in an asset-class premium of 100 to 400 basis points, plus any deal-specific adjustments for:
- location
- tenant credit
- deferred maintenance
- execution risk
The key is simple: write down each piece of the rate instead of picking one by feel.
You can also use institutional target IRRs or your WACC as a starting point.
When should I use WACC instead of a build-up rate?
Use WACC when you want your valuation to reflect the cost of both debt and equity based on your financing mix. REITs often use WACC as a starting point, then adjust it for the risks tied to a given asset.
Use a build-up rate when you start with a risk-free rate and then layer on asset-class and property-specific risk premiums for a given investment.
What are the biggest red flags in a DCF discount rate?
The biggest red flags are inconsistent methodology and weak support. A discount rate shouldn’t be a round number you picked because it “sounds about right.” It needs to come from a documented buildup that you can explain and defend.
Watch for mismatches too. For example:
- Using a real discount rate with nominal cash flows
- Using WACC for cash flows that already reflect debt service
Sensitivity analysis also matters. Even a 1% change can materially affect value.