
Why IRR Can Mislead CRE Investors

A high IRR can point you to the wrong CRE deal. I’d never read IRR by itself because timing, leverage, refinance proceeds, and sale assumptions can push the number up even when the property itself is not doing much better.
Here’s the short version:
- IRR favors early cash back. A refinance in year 3 can lift IRR even if total profit stays lower.
- IRR can hide total dollars earned. A 15% IRR over 5 years can lose to an 11% IRR over 10 years if the second deal returns more cash overall.
- Leverage can inflate the headline return. A smaller equity check can make returns look stronger without improving the asset.
- IRR assumes interim cash can be reinvested at the same rate. That often fails in practice. In one May 2026 example, IRR was 22.0%, but MIRR fell to 14.5% when reinvestment was set to 5%.
- Exit assumptions often do the heavy lifting. In many value-add deals, 60% to 70% of total proceeds come at sale.
- You need other metrics too. I’d check equity multiple, cash-on-cash return, annual cash yield, unlevered IRR, levered IRR, and the full cash flow schedule before making a call.
My takeaway: IRR is a useful shortcut, but it is not the decision rule. If you want a cleaner read on a deal, look at how fast cash comes back, how much cash comes back, and how much of the story depends on the sale.
IRR vs. Key CRE Metrics: What Each One Tells You (And What It Misses)
Mastering the IRR Intricacies in Real Estate Investing
sbb-itb-df8a938
Quick Comparison
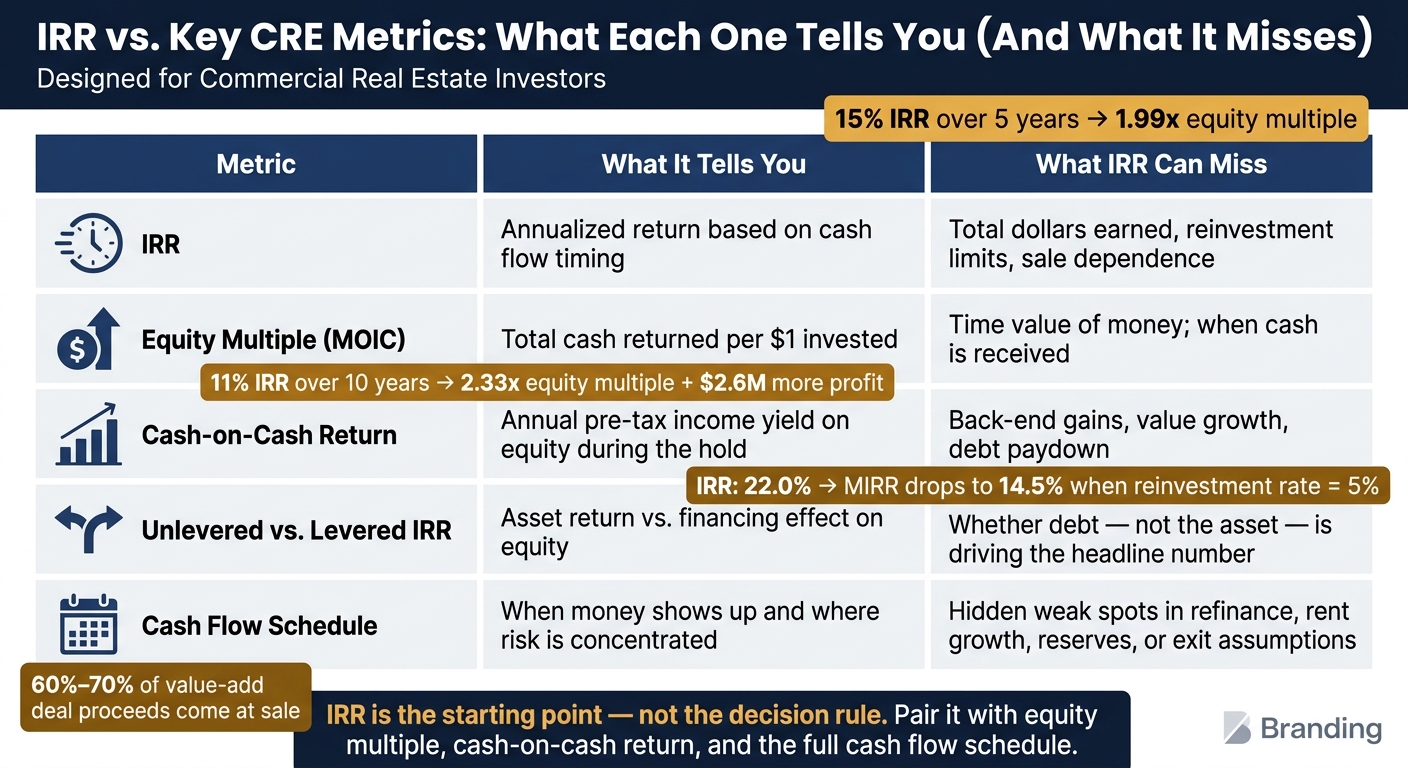
| What to check | What it tells me | What IRR can miss |
|---|---|---|
| IRR | Annualized return based on timing | Total dollars, reinvestment limits, sale dependence |
| Equity Multiple | Total cash returned per $1 invested | Time value of money |
| Cash-on-Cash Return | Income during the hold | Back-end gains and sale upside |
| Unlevered vs. Levered IRR | Asset return vs. financing effect | Whether debt is driving the headline number |
| Cash Flow Schedule | When money shows up and where risk sits | Hidden weak spots in refinance, rent growth, reserves, or exit assumptions |
If I’m underwriting or reviewing a CRE deal, I use IRR as the starting point - not the final answer.
Where IRR breaks down in commercial real estate
How timing can make a deal look better
In CRE, timing can make the same total profit look a lot better on paper. If a deal returns cash early through a refinance, a partial sale, or front-loaded distributions, it will post a higher IRR than a deal with the same total proceeds that pays most of the money back at the end. That makes IRR easy to compare, but also easy to read the wrong way.
Here’s the catch: a 15% IRR office deal over 5 years can produce a 1.99x equity multiple, while an 11% IRR retail deal over 10 years can produce a 2.33x multiple and $2.6 million more profit [2]. On the surface, the first deal looks stronger. In dollars, the second one can win by a mile. That’s where IRR can steer investors toward the wrong deal. And when debt enters the picture, the gap can get even more misleading.
How leverage can make returns look stronger than they are
Debt boosts equity returns. If you write a smaller equity check, the same property result can show up as a higher percentage return on that smaller base. That’s leverage at work. It does not mean the property is doing a better job.
A common example is an interest-only loan period. It shifts cash into the early years, which pushes IRR up because IRR is highly sensitive to when cash shows up. But that early bump can fade once amortization starts and cash flow drops.
Unlevered IRR shows the return from the asset itself, without financing. Levered IRR shows the return to equity after debt service, including refinance risk, interest rate exposure, and bridge-to-permanent loan risk. Looking at both side by side helps separate property performance from financing effects. Once debt is in the model, IRR can climb even if asset quality hasn’t changed at all.
IRR ignores scale, risk, and cash-flow shape
IRR is just a percentage. It doesn’t tell you how many dollars sit behind that number. A 30% IRR over two years and a 12% IRR over five years can both produce the same 1.6x equity multiple, which means the same total profit [3]. The higher IRR changes the timing, not the amount of profit.
That’s a big blind spot. IRR can treat a stable core asset and a volatile opportunistic deal as equals if the projected IRR is the same. It can also rank two deals the same even when one is larger, safer, and built to hold up better over time.
The next issue is that IRR can also overstate returns because of its reinvestment and exit assumptions.
Why IRR can look better than the actual investment outcome
The reinvestment assumption is often unrealistic
Leverage isn't the only reason IRR can make a deal look stronger than it may turn out in practice. IRR also bakes in rosy assumptions about reinvestment and the exit. It assumes interim cash flows can be reinvested at the same rate as the deal itself, which rarely happens in the real world[1].
A May 2026 analysis makes this pretty clear. In a $10 million value-add multifamily deal with a seven-year hold, $2 million in annual distributions, and a $3 million refinance in year 3, the IRR came out to 22.0%. But when the reinvestment rate was set to 5%, the MIRR dropped to 14.5%[4].
That gap matters. It shows how a strong-looking IRR can lean heavily on assumptions that may not hold up once cash actually hits the investor's account.
The same issue shows up at sale. If the model leans too hard on a strong exit, IRR can look great on paper even when the path to get there is less impressive.
Exit timing can drive the reported IRR
In many value-add deals, the sale does a lot of the heavy lifting. That means the reported IRR often depends more on exit price and timing than on the property's year-to-year cash flow. On a typical five-year value-add hold, exit proceeds can make up 60% to 70% of total deal proceeds[5].
Here's the tell: when annual cash yield looks modest but IRR looks high, the return is often being driven by the exit[2].
A simple way to pressure-test that story is to tweak the sale assumptions:
If the return changes a lot from those small shifts, that's a sign the headline IRR may be doing more sales work than operating work.
What to review alongside IRR before making a decision
After you test where IRR starts to wobble, the next step is simple: check total profit, current income, and deal risk.
Pair IRR with equity multiple, cash-on-cash return, and annual cash yield
IRR tells you how fast capital works. It does not tell you the full profit story on its own.
That’s why a few supporting metrics matter.
The equity multiple (also called MOIC) answers one of the most basic questions in real estate: how many dollars came back for every dollar invested? Use equity multiple to judge total profit when hold periods differ. If IRR looks strong because of timing, this metric helps you see whether the deal still produces actual value.
Cash-on-cash return measures the annual pre-tax cash flow yield on equity. In plain English, it shows whether the deal throws off cash during the hold period. For investors who care about income, or for stabilized assets, this can matter more than the terminal IRR.
IRR shows speed, not total wealth.
Use these three metrics together to separate speed, profit, and income:
| Metric | What It Measures | Where It Helps | What It Misses |
|---|---|---|---|
| IRR | Annualized efficiency of capital | Comparing deals with different timelines; institutional benchmarking | Reinvestment reality; total dollar magnitude |
| Equity Multiple | Total cash return (inflows / outflows) | Judging absolute wealth creation; long-term holds | Time value of money; when cash is received |
| Cash-on-Cash | Annual yield (cash flow / equity) | Evaluating current income durability; stabilized assets | Value growth; backend gains; debt paydown |
Used together, these metrics give you a cleaner read on speed, profit, and income.
And if debt is pushing the return around, the next place to look is the capital stack.
Review levered and unlevered returns side by side
Compare levered and unlevered returns side by side to separate financing effects from property performance.
The unlevered IRR shows what the property earns on its own, without financing. The levered IRR shows what equity investors earn after debt service. If the spread between the two is wide, the deal may depend more on loan terms than on the asset itself. The property didn’t change. Only the capital structure did.
That deserves a close look in value-add deals, bridge-loan deals, and refinance-heavy business plans. In those cases, aggressive leverage can make weak property fundamentals look better than they are. Institutional partners usually ask for both figures for this exact reason[6].
Once you strip out financing, the next step is to read the cash flow schedule itself.
Read the actual cash flow schedule, not just the summary metrics
Summary metrics are the starting line, not the finish line. The real story sits in the year-by-year cash flow schedule.
When you review it, focus on three things:
- Sale concentration: If most of the proceeds show up at sale, the IRR depends heavily on exit timing and exit pricing[2].
- Refinance realism: Check whether any projected mid-hold refinance loan-to-value is realistic in the current debt market[6].
- Cash-flow dips: Look for years where cash flow falls hard. That often points to lease expirations, major capital spending, or vacancy assumptions that need a closer read[2][6].
If the model assumes 5%+ annual rent growth in a flat market, or leaves out normal reserves and leasing commissions, then NOI - and the IRR built on top of it - is already overstated before you even get to the exit[6]. The full schedule is usually where those weak assumptions show up first.
Conclusion: Use IRR as one input, not the decision rule
Once you’ve tested timing, leverage, and exit assumptions, the next step is simple: decide how much weight IRR should get. It matters, but it shouldn’t run the whole show. Timing, exit assumptions, and leverage can make a weak deal look great on paper.
IRR gives you a summary of a deal. It does not tell you why the return looks the way it does.
That’s why it helps to look at IRR alongside equity multiple, cash-on-cash return, and the year-by-year cash flow schedule. Put those pieces together, and you get a much clearer picture than IRR can give on its own.
Key takeaways for underwriting and investor reporting
Before you sign off on a model, run these three checks:
- Never compare reported IRRs without matching hold periods. A shorter hold can push IRR higher even when the deal does not produce more total profit.
- Always separate levered from unlevered performance. If the gap is wide, the deal leans hard on leverage rather than the asset itself.
- Pressure-test the exit before presenting any return. Model the exit cap rate at least 50 to 100 basis points wider than your entry assumption [5]. If IRR falls fast, the return leans heavily on the exit.
IRR is a starting point, not the decision rule.
FAQs
When is IRR most misleading in CRE?
IRR can be misleading in CRE when cash flows swing a lot, arrive early in the deal, or depend on rosy assumptions. In those situations, it can make returns look better than they are.
It also doesn’t tell you the full profit picture, and it can get skewed by reinvestment assumptions that don’t match how deals work in practice.
How do I compare a high-IRR deal to a higher-profit deal?
IRR shows how fast and how efficiently returns come back. Total profit or equity multiple shows the total dollars earned. So a high IRR can point to faster returns, not always more profit.
Look at both in context: use IRR to judge speed and timing, and use total profit or equity multiple to judge overall gains. Add cash-on-cash return and risk to the mix, and you get a much clearer view.
Which metrics should I review alongside IRR?
Review IRR alongside metrics like equity multiple, cash-on-cash return, MOIC, CAGR, DPI, and MIRR. Taken together, these metrics give you a much better read on performance.
Why? Because IRR on its own can be misleading. It’s useful, but it doesn’t tell the whole story. A deal can post a high IRR because cash comes back early, even if the total profit isn’t that large. Another deal might show a lower IRR but produce more dollars over time.
That’s where the other metrics help:
- Equity multiple and MOIC show how much money an investment returned compared with the amount put in
- Cash-on-cash return helps you see how steady the cash flow is
- CAGR gives a simple annualized growth rate
- DPI shows how much capital has actually been paid back to investors
- MIRR adjusts for reinvestment assumptions, which can make the picture more realistic
Used together, these numbers give a fuller view of total return, cash flow stability, risk, and reinvestment assumptions.