
Ultimate Guide to Return Metrics in Commercial Real Estate
Return metrics are essential for evaluating the financial performance of commercial real estate investments. They help investors measure profitability, compare properties, and align investments with specific financial goals. This guide explains five key metrics every investor should understand:
Net Operating Income (NOI): Measures a property's annual income after operating expenses.
Capitalization Rate (Cap Rate): Compares NOI to property value, helping assess yield and risk.
Cash-on-Cash Return: Focuses on annual cash flow relative to cash invested, ideal for short-term income analysis.
Internal Rate of Return (IRR): Evaluates long-term profitability, factoring in the time value of money.
Equity Multiple: Shows the total return on investment, indicating how many times the initial investment is recovered.
Each metric serves a unique purpose, and using a combination of them provides a clearer picture of an investment's potential. Whether you're prioritizing steady income or long-term growth, these tools can guide smarter decision-making in real estate.
Ranking the 5 Most Common Real Estate Return Metrics
Key Return Metrics Explained
This section breaks down five key metrics that play a central role in investment analysis. Each one builds upon earlier concepts, offering practical insights for evaluating investments at every stage.
Net Operating Income (NOI)
NOI is a measure of a property's profitability after accounting for operating expenses. Here's the formula:
NOI = Gross Operating Income – Operating Expenses.
Gross operating income includes all rental and additional revenues, while operating expenses cover property management, maintenance, insurance, taxes, and utilities. However, financing costs and one-time expenses are excluded.
Take Prologis as an example. In 2021, they reported $4,148 million in rental revenues and $20 million from development management. After deducting $1,041 million in rental expenses and $22 million in other expenses, their NOI came to $3,105 million. By 2022, this figure increased to $3,688 million - a 19% rise.
NOI is more than just a profitability snapshot; it’s also a foundational metric for other calculations and a key indicator for lenders assessing income potential. A negative NOI, however, signals trouble, as it means operating costs exceed earnings.
Capitalization Rate (Cap Rate)
The cap rate compares a property's income to its market value, calculated as:
Cap Rate = NOI ÷ Property Value.
For instance, if a property generates $100,000 in NOI and is valued at $1,250,000, the cap rate is 8%. Typical cap rates range from 4% to 10%, varying by property type. In February 2022, median cap rates were around 5.1% for multifamily properties, 7.1% for office buildings, 6.3% for industrial properties, and 6.9% for retail properties.
Higher cap rates often indicate higher risk, while lower cap rates suggest more stable, lower-risk investments. As JPMorgan Chase notes:
“Cap rates are just one unit of comparison used for evaluating commercial real estate; both macroeconomic and property specific characteristics should be considered when determining an appropriate cap rate for any specific property.”
Cap rates also help estimate payback periods. For example, a 5% cap rate implies it would take roughly 20 years to recover the investment through income alone (100% ÷ 5% = 20 years).
Cash-on-Cash Return
This metric focuses on the actual cash you earn compared to the cash you’ve invested, making it particularly useful for investors seeking immediate income. The formula is:
Cash-on-Cash Return = Annual Pre-Tax Cash Flow ÷ Total Cash Invested
For example, if you invest $300,000 and earn $24,000 in pre-tax cash flow annually after expenses and debt payments, your cash-on-cash return is 8%. While this metric highlights yearly cash yield, it doesn’t account for factors like future income changes, capital investments, or appreciation over time.
Internal Rate of Return (IRR)
IRR takes a broader view by incorporating long-term cash flow dynamics, making it an essential tool for evaluating an investment’s total profitability.
This metric calculates an annualized return rate that factors in the time value of money, considering all cash flows - initial investment, annual returns, and eventual sale proceeds. Unlike simpler metrics, IRR acknowledges that a dollar today is worth more than a dollar in the future. For example, a 12% IRR indicates an annualized return of 12% over the investment period. This makes IRR particularly valuable for comparing investments with varying cash flow patterns or holding periods.
Equity Multiple
Equity Multiple provides a straightforward way to gauge total return potential by showing how many times you can recover your original investment. The formula is:
Equity Multiple = Total Cash Inflows ÷ Total Cash Invested
For instance, if you invest $500,000 and ultimately receive $1,200,000 in total cash flows, your equity multiple is 2.4x - meaning you recovered your initial investment 2.4 times over. However, this metric doesn’t account for the time value of money. A 2.0x return over three years is far better than the same return achieved over ten years. Pairing this metric with IRR gives a fuller picture of investment performance.
Each of these metrics serves a unique purpose: NOI highlights operational efficiency, cap rate aids in quick valuations, cash-on-cash return focuses on immediate cash flow, IRR offers a long-term view, and equity multiple captures total return potential. Knowing when and how to apply these tools can significantly improve your investment decisions.
How to Calculate and Interpret Each Metric
Knowing the formulas is just the beginning - applying them correctly and interpreting the results in context is where the real value lies. Let’s break down the steps for calculating key metrics and understanding what they reveal about your investment.
Step-by-Step Calculations
Net Operating Income (NOI) is the starting point for most calculations. To find NOI, add up gross operating income and other income, then subtract operating expenses. Here’s the formula:
(Gross Operating Income + Other Income) - Total Operating Expenses.
Take a 50-unit apartment building in Dallas as an example. It generates $600,000 annually in gross rental income, plus $15,000 from laundry and parking fees. Operating expenses include $45,000 for property management, $35,000 for maintenance, $25,000 for insurance, $40,000 for property taxes, and $20,000 for utilities. The NOI calculation looks like this:
($600,000 + $15,000) - ($45,000 + $35,000 + $25,000 + $40,000 + $20,000) = $450,000.
Capitalization Rate (Cap Rate) is calculated with NOI as the numerator. The formula is:
Net Operating Income ÷ Current Market Value.
Using the Dallas property example, with an NOI of $450,000 and a purchase price of $4,500,000, the cap rate works out to 10% ($450,000 ÷ $4,500,000). This metric shows the property’s potential yield without considering financing.
Cash-on-Cash Return measures actual cash flow after debt payments. The formula is:
Annual Pre-Tax Cash Flow ÷ Initial Equity Investment.
If the property generates $300,000 in net cash flow after mortgage payments and you’ve invested $1,350,000 in equity (30% down), the cash-on-cash return is 22.2% ($300,000 ÷ $1,350,000).
Internal Rate of Return (IRR) requires projecting cash flows over the holding period. It’s the discount rate that makes the net present value (NPV) of all future cash flows equal zero. For example, if you invest $1,000,000 upfront and receive annual cash flows of $100,000, $125,000, $150,000, and $175,000, plus $2,000,000 from a sale in year five, the IRR comes to 23.91%.
Equity Multiple shows the total return on your investment. The formula is:
Total Cash Received ÷ Total Cash Invested.
If you invest $1,000,000 and receive $2,550,000 in total cash flows, your equity multiple is 2.55x. This metric provides a straightforward way to evaluate overall performance.
Once you’ve calculated these metrics, compare them to market benchmarks to assess how competitive your investment is.
Understanding Benchmarks and Market Standards
Benchmarks help you determine whether your investment goals align with market conditions. These standards differ by property type and strategy. For instance, prime Class A office buildings often have cap rates between 7% and 8%, while Class B/C properties might range from 10% to 14%.
IRR expectations also vary by risk level. Core investments with lower risk typically aim for IRRs of 8%–12%, while value-add strategies target 12%–16%. Higher-risk, speculative projects often seek IRRs above 16%.
Cash-on-cash return expectations have been rising. Surveys suggest a target of at least 8% for acquisitions in 2024. Here’s a breakdown by property type:
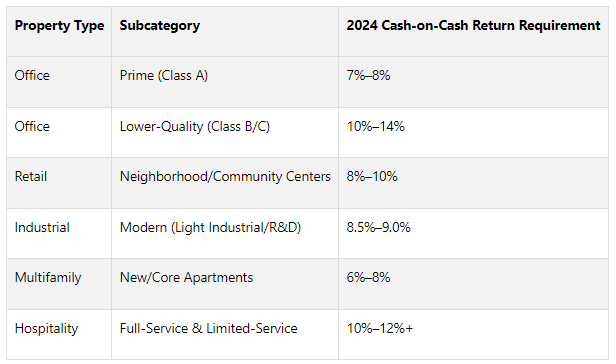
Equity multiples of 2.5x or higher are common for commercial real estate. However, the timeframe matters - a 2.0x return over three years is far more appealing than the same return over ten years.
Common Mistakes and How to Avoid Them
Even with a solid understanding of the calculations, it’s easy to make errors. Here are some common pitfalls and how to sidestep them:
Mixing Metrics: Cash-on-cash return uses pre-tax cash flow after debt payments, while cap rate is based on NOI before debt service. Keep them separate.
Relying on One Metric: Cap rates provide a snapshot of current yield, but they don’t account for long-term returns. IRR, on the other hand, factors in cash flow timing and sale proceeds, offering a fuller picture.
Overlooking Timeframes: A high equity multiple isn’t always impressive if it takes too long to achieve. Combining equity multiple with IRR reveals both total return and cash flow timing.
Unrealistic Projections: Pro forma statements should be grounded in reality. Base income growth, expenses, and capital expenditure estimates on historical data from comparable properties.
Transform Your Real Estate Strategy
Access expert financial analysis, custom models, and tailored insights to drive your commercial real estate success. Simplify decision-making with our flexible, scalable solutions.
Comparing Return Metrics: Strengths and Weaknesses
Understanding return metrics is like having a toolkit - each tool serves a specific purpose. Every metric sheds light on a different aspect of an investment's performance, offering unique insights and limitations. By comparing these metrics, you can better align them with your investment strategy.
Metric Comparison Table

Choosing the Right Metric for Your Strategy
Selecting the right metric depends on your investment goals and the timeline of your strategy. Each metric brings something unique to the table, and knowing when to use them can make a significant difference.
For income-focused investors, metrics like NOI and cash-on-cash return are key. These focus on regular cash flow, making them ideal for strategies that prioritize steady income over time.
On the other hand, growth-oriented investors often lean on IRR, especially for value-add projects. IRR captures the bigger picture, factoring in long-term appreciation and the timing of returns, which is critical for projects with significant growth potential.
Core investors, who focus on stable, long-term holdings, typically start with cap rates to screen properties. Cap rates help identify opportunities that align with market standards. Once a property is identified, IRR can be used to confirm that the investment aligns with long-term return expectations.
For example, if immediate cash flow is your priority, look for properties with higher cash-on-cash returns. But if you're more interested in long-term growth, an attractive IRR may signal better appreciation potential.
Syndication sponsors often highlight equity multiple because it’s straightforward for passive investors to grasp. For instance, a 2.5x equity multiple clearly communicates that an investor will receive $2.50 for every dollar invested. Sponsors often pair this with IRR to demonstrate that these returns are achievable within a reasonable timeframe.
Finally, portfolio managers take a more layered approach, integrating multiple metrics to create a well-rounded analysis. This prevents over-reliance on any single metric and provides a clearer picture of an investment's potential.
The key is to match your metrics to your objectives and holding period. Short-term strategies benefit from metrics like cash-on-cash return, while long-term investments often rely on IRR or equity multiple. By tailoring your approach, you can make smarter, more informed decisions in commercial real estate.
Using Return Metrics with The Fractional Analyst

The Fractional Analyst takes the essential return metrics discussed earlier and turns them into actionable tools for real estate professionals. These resources are designed to simplify analysis, making it easier to move from modeling to performance tracking without slowing down your decision-making process.
The Fractional Analyst's Tools
The Fractional Analyst offers a range of tools that simplify return metric calculations and take the guesswork out of the process. Among these are free, ready-to-use templates tailored for multifamily, mixed-use, and IRR calculations.
These templates aren’t just basic spreadsheets. They’re built with industry-standard assumptions and formatting, making them easy to customize for specific deals. Whether you’re dealing with value-add projects or multi-phase developments, these professionally designed models save you from creating complex spreadsheets from scratch or struggling with one-size-fits-all templates.
For more advanced needs, The Fractional Analyst provides customized financial analyst services. These services include underwriting, asset management, market research, investor reporting, and even creating pitch decks - all without the need for full-time staff. This setup allows you to tap into expert-level analysis for handling return metrics on a project-by-project basis.
Another standout feature is CoreCast, a platform that automates underwriting and slashes analysis time from hours to minutes. By integrating market trends, tenant behaviors, and economic forecasts, CoreCast doesn’t just calculate returns - it also delivers dynamic risk assessments alongside your metrics.
How The Fractional Analyst Supports Decision-Making
The Fractional Analyst doesn’t stop at providing tools - it also helps refine your investment strategies. By combining return metrics with real-time updates and market insights, their services give you a clearer picture of how your investments stack up. For example, when comparing properties with similar IRRs, their market research can pinpoint which deal has better long-term potential based on submarket trends and tenant demand.
Their unified dashboard approach solves a common problem in real estate analysis: juggling data across multiple platforms like Excel, SharePoint, and ARGUS. CoreCast brings all this information together in one place. This means your calculations automatically include up-to-date rent rolls, expense data, and market comparables.
Integration with your existing systems ensures your analysis reflects real-time data instead of outdated spreadsheets. For instance, if a lease renewal impacts your NOI projections, these changes automatically flow through to your cap rate and cash-on-cash return calculations.
For portfolio management, The Fractional Analyst’s tools let you track performance across multiple assets at once. You can see how actual returns compare to your projections and quickly identify which properties are exceeding or falling short of expectations.
Getting More Done with CoreCast

CoreCast is changing the game for commercial real estate professionals by offering a faster, smarter way to analyze return metrics. With just basic property details, CoreCast generates a full analysis, including sensitivity scenarios and risk assessments.
Its live-linked portfolios ensure your calculations stay up-to-date as market conditions shift. For example, when cap rates in your market change, CoreCast automatically updates your property valuations and return projections. The platform’s integration with third-party data sources enhances accuracy by pulling in real-time market information. Instead of manually researching comparable sales or lease rates, CoreCast handles it for you and applies the data directly to your analysis.
During its beta phase, CoreCast is priced at $50 per user per month, with full pricing set to rise to $105 per user per month. Even at the higher price, it’s far more cost-effective than traditional solutions while offering a broader range of features. Designed for everyone in the commercial real estate space - from analysts handling underwriting to executives making final decisions - CoreCast is built to meet the industry’s needs. Additionally, real estate professionals can join The Fractional Analyst’s Alpha Group to provide feedback on CoreCast and ensure it addresses practical challenges in return metric analysis.
Key Takeaways for Commercial Real Estate Investors
Knowing how to use return metrics effectively is about more than just crunching numbers - it’s about making smarter, more informed investment decisions. These metrics help you assess opportunities, monitor performance, and communicate results clearly.
Summary of Key Metrics and Their Uses
Every return metric has its own role in your investment analysis. Here’s a quick breakdown:
NOI (Net Operating Income): Focuses on operational profitability.
Cap Rate: Translates NOI into an estimate of property value. For example, current market cap rates range from 4.9% for multifamily properties to 6.9% for office buildings.
Cash-on-Cash Return: Measures annual cash yield, with a typical target range of 8% to 12%.
IRR (Internal Rate of Return): Reflects annualized returns over the holding period, with targets often between 8% and 20%, depending on the strategy.
Equity Multiple: Complements IRR by showing total return on investment, with target ranges from 1.5x to 3.0x.
The main takeaway? No single metric tells the full story. For example, a property with a high IRR might struggle with cash flow, while a deal boasting strong cash-on-cash returns may lack long-term appreciation potential. Successful investors use a combination of these metrics to get a well-rounded view.
Next Steps with The Fractional Analyst
Once you’ve got a solid understanding of these metrics, the next step is putting them to work. Start by using The Fractional Analyst’s free, industry-specific templates to apply these metrics to your current investments.
For more advanced needs, their customized financial services can help with underwriting, asset management, and investor reporting - giving you access to expert-level analysis without the cost of hiring full-time staff.
Looking to save time? CoreCast is a game-changer. It automates calculations that used to take hours, delivering results in minutes. This real-time tool simplifies your workflow and keeps your analyses up to date.
Keep in mind, the best investors continually revisit their metrics as market conditions shift. Regular updates to IRR and equity multiple calculations ensure you stay ahead of the curve.
Whether your focus is steady cash flow through NOI and cash-on-cash returns or long-term growth via equity multiples, align your metrics with your investment goals and holding periods. The key is consistency - applying these tools regularly helps you make data-driven decisions that set you apart from the competition.
FAQs
-
The return metric you should focus on largely depends on what you're trying to achieve with your investment. For those targeting long-term growth, the Internal Rate of Return (IRR) is particularly useful. It factors in the time value of money, giving you a comprehensive view of the investment's overall performance over time.
If your focus is on short-term cash flow, the cash-on-cash return is a better fit. This metric highlights the cash income you're generating compared to the amount you initially invested, offering a straightforward way to evaluate immediate returns.
To pick the right metric, think about your goals, how long you plan to invest, and your comfort with risk. Matching your analysis to the most suitable metric helps you make smarter decisions that align with your investment strategy.
-
Investors in commercial real estate often stumble when using return metrics, leading to flawed evaluations and, ultimately, poor decisions. One common mistake is overlooking key expenses - things like maintenance costs, property taxes, or management fees. Ignoring these can distort calculations such as ROI or cash-on-cash return, giving a misleading picture of an investment's performance. Another frequent misstep is misapplying metrics, using the wrong one for the wrong purpose, which can steer analysis in the wrong direction.
To steer clear of these errors, start with thorough due diligence on both the property and the market. Make sure your data is accurate and complete, and take the time to fully understand the metrics you're working with. For instance, the IRR is ideal for evaluating long-term investment performance, while the cap rate offers a quick look at a property's current income potential. By double-checking your numbers and tailoring your approach to the specific investment, you’ll be better equipped to make smarter, data-backed decisions.
-
The tools offered by The Fractional Analyst are built to make your real estate investment decisions easier and more informed. They provide features for detailed financial analysis, allowing you to dive into market research, perform underwriting, and evaluate risks specifically tied to the U.S. real estate market. These tools give you the ability to assess potential investments with greater confidence and accuracy.
Additionally, their advanced forecasting models - like ARIMA and machine learning - enable you to predict cash flows, estimate returns, and pinpoint possible risks. Armed with these data-driven insights, you can make smarter, more strategic investment decisions that align with your financial objectives.