
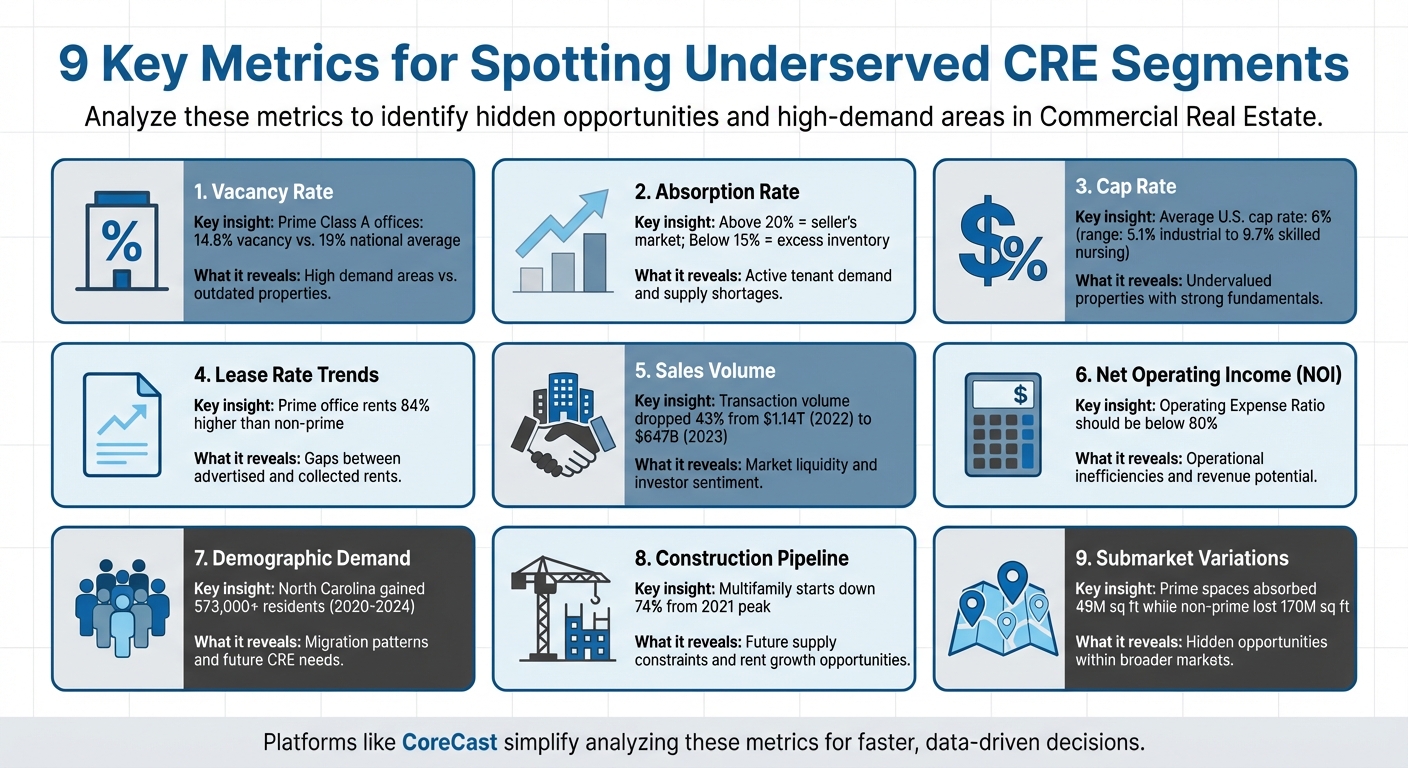
Top Metrics for Spotting Underserved CRE Segments

Investing in underserved commercial real estate (CRE) markets requires tracking the right metrics. These metrics help identify areas where demand exceeds supply, offering opportunities for growth and profit. Key factors include vacancy rates, absorption rates, cap rates, lease trends, sales volume, net operating income (NOI), demographic shifts, construction pipelines, and submarket variations.
Here’s what matters most:
- Vacancy Rates: High rates may indicate outdated properties, while low rates point to high demand.
- Absorption Rates: Positive absorption shows growing tenant interest and potential supply gaps.
- Cap Rates: Analyze where market sentiment undervalues strong-performing properties.
- Lease Rate Trends: Look for gaps between advertised and collected rents to assess demand.
- Sales Volume: Tracks liquidity and investor interest.
- NOI: Highlights operational inefficiencies and revenue potential.
- Demographic Data: Migration patterns and aging populations drive specific CRE needs.
- Construction Pipeline: Limited new supply can create opportunities for rent growth.
- Submarket Variations: Localized data reveals hidden opportunities within broader markets.
Platforms like CoreCast simplify analyzing these metrics, helping investors act quickly and accurately. By understanding these trends, you can target high-demand segments like industrial spaces, premium offices, or suburban Build-to-Rent developments.
9 Key Metrics for Identifying Underserved Commercial Real Estate Markets
1. Vacancy Rate
Relevance to Identifying Underserved CRE Opportunities
Vacancy rates provide a clear lens into where demand exists but isn’t being met - if you dig into the details. For instance, while the national office vacancy rate hit 19% in April 2025[6], the numbers tell a more nuanced story. Prime Class A office spaces had a significantly lower vacancy rate of 14.8% in Q1 2024, which was 4.5 percentage points below non-prime properties[6]. This gap highlights a key insight: tenants are willing to pay more for high-quality spaces, even as older buildings sit empty.
Sometimes, high vacancy rates don’t reflect weak demand but rather outdated properties. Take Chicago’s $151 million project, which transformed 2.3 million square feet of office space into 1,000 apartments[6]. This approach tackled both office space oversupply and urban housing shortages, showing how adaptive reuse can address mismatches in supply and demand.
Ability to Highlight Supply-Demand Mismatches
Looking beyond metro-wide averages and focusing on property class and submarkets can reveal hidden opportunities. As Julie Whelan, Global Head of Occupier Research at CBRE, explains:
It is a varied story market to market and even within submarkets[6].
While the national vacancy rate hovers around 19%, cities like Miami (15.5%) and Manhattan (16.2%) have tighter supply, particularly for Class A properties[6]. Between 2020 and 2024, prime office spaces absorbed 49 million square feet, while non-prime properties shed a staggering 170 million square feet[6]. This divergence highlights where investment can yield the best returns - whether through acquiring in-demand Class A assets or repositioning outdated Class B/C buildings.
Adaptive reuse is gaining traction. By Q3 2024, 71 million square feet (1.7% of the U.S. office inventory) was planned for or undergoing conversion. Since 2016, office-to-multifamily projects have added 28,000 new housing units, with another 38,000 in progress[6]. These trends emphasize the growing potential for repurposing underperforming assets.
Applicability to Niche or Secondary Markets
Secondary markets often show even greater variations in vacancy rates, with localized demand pockets hidden behind citywide averages. Bryan C. Connolly, Partner at DLA Piper, notes:
Class B and C offices are struggling... Some explore conversions to residential or mixed uses, while others restructure or hold out for better conditions[6].
Underperforming Class B and C properties in these markets present prime opportunities for conversion, especially in areas with housing shortages. For savvy investors, these assets represent the kind of untapped potential that can transform underserved segments into thriving developments.
sbb-itb-df8a938
2. Absorption Rate
Relevance to Identifying Underserved CRE Opportunities
Vacancy rates may show where supply is lacking, but net absorption reveals where tenant demand is actively growing. Net absorption measures the difference between the total space leased and the space vacated. When this figure is positive, it means more space is being occupied than emptied - an indicator of strong demand. This is where developers and investors can step in to address potential supply shortages. As FNRP explains:
Net absorption rate is the better indicator of a market's true demand. If the market has a positive net absorption rate, it means that more space is being leased than is being moved out[9].
This metric is particularly useful for value-add strategies. For example, if you're considering renovating an older industrial building or repositioning a retail property, the local absorption rate can give you a realistic idea of how quickly you might lease up the space and start generating income[9]. By validating tenant demand, it becomes a cornerstone for creating accurate cash flow projections and understanding supply-demand dynamics.
Ability to Highlight Supply-Demand Mismatches
Absorption rates provide a clear picture of market conditions. A rate above 20% typically signals a seller's market with high demand, while rates below 15% point to excess inventory[10]. For instance, the industrial sector currently averages a 9.1% absorption rate nationwide, driven by e-commerce and logistics. In contrast, hotel and hospitality properties lag significantly, with an average of just 4.3%[7].
Looking across property types, the differences are striking. Between 2026 and 2030, industrial real estate is expected to remain in high demand, with a projected strength score of 9.5 out of 10, thanks to trends like reshoring and the continued growth of e-commerce[1]. Meanwhile, the office market tells a more complicated story. High-end Class A buildings with modern amenities are still attracting tenants, while lower-tier Class B and C properties face negative absorption, meaning more space is being vacated than leased[1].
Applicability to Niche or Secondary Markets
Absorption rates can vary widely, not just between cities but even within neighborhoods[7]. For investors focused on secondary markets, this level of detail can provide a competitive edge. For instance, while a city’s overall absorption rate might seem unremarkable, specific submarkets could show intense demand. Examples include cold storage facilities near border regions benefiting from nearshoring or Build-to-Rent housing developments in suburban areas where families seek managed rental options[1].
When analyzing niche segments, it’s better to rely on net absorption rather than gross absorption. Gross absorption only shows the total space leased, which can be misleading if large amounts of space are also being vacated simultaneously[8][9]. Specialized asset types often deviate from general market trends, helping investors uncover opportunities that broader metrics might overlook[1].
3. Cap Rate
Relevance to Identifying Underserved CRE Opportunities
Cap rate analysis plays a key role in spotting areas where market sentiment doesn't align with underlying fundamentals. The cap rate, which measures the ratio of a property's net operating income to its purchase price, helps uncover opportunities where properties may be undervalued. For instance, when a market segment shows high cap rates but also boasts strong fundamentals - like low vacancy rates and steady rent growth - it often signals untapped potential. Aaron Jodka, Director of National Capital Markets Research at Colliers, highlights this idea:
There's an argument to be made that retail is mispriced, that cap rates are too high, given its performance. [12]
A great example of this is the grocery-anchored retail sector. In Q3 2025, cap rates for these properties compressed by 18 basis points to 6.5% as private funds began recognizing their stability. Such gaps between cap rates and performance can create excellent entry points for investors looking for both steady cash flow and long-term value growth. These discrepancies often encourage a closer look at how different asset classes are performing.
Effectiveness in Evaluating Financial or Market Performance
Beyond identifying undervalued opportunities, cap rates are also a reliable tool for assessing market performance. They reflect how the market values different risk profiles. As of September 2025, the average cap rate across all U.S. asset classes was 6%, but the spread between sectors was significant - 5.2 percentage points[12]. For instance, industrial assets had a low cap rate of 5.1%, driven by strong e-commerce demand, while skilled nursing facilities saw much higher cap rates of 9.7%, reflecting the operational challenges they face.
Office buildings also showed interesting trends, with cap rates dropping by 24 basis points year-over-year as investors pursued trophy properties and distressed assets[12]. For investors, the trick is to understand what drives these numbers. A 6% cap rate in a thriving suburban market might outperform an 8% cap rate in an urban area that's in decline[11]. The real insight lies in determining whether the cap rate reflects actual risk or short-term market sentiment.
Applicability to Niche or Secondary Markets
Cap rates in secondary markets are often higher, compensating for lower liquidity. For example, in early 2026, cities like Memphis (8.4%), Cleveland (8.1%), and Detroit (8.8%) reported higher cap rates compared to prime markets like San Jose, which had a much lower cap rate of 3.1%[11]. These higher yields can make it easier to meet debt service coverage ratios (DSCR) and provide immediate cash flow. However, investors need to carefully assess whether the higher cap rates reflect genuine opportunities or underlying market weaknesses.
Niche assets, on the other hand, can show even more variation. By late 2025, cell and radio towers traded at cap rates of 4.5%, benefiting from their infrastructure-like stability, while data centers averaged 6.1%[12]. When diving into niche markets, it's crucial to account for local costs - like insurance premiums in states such as Florida or Texas, which can range from $4,000 to $6,000 annually. These expenses effectively lower the cap rate and should be factored into any investment decision.
4. Lease Rate Trends
Relevance to Identifying Underserved CRE Opportunities
Lease rate trends offer valuable insights into shifting demand patterns. A critical factor to watch is the gap between advertised rents and collected rents after concessions. When this gap widens, it often signals underlying market softness, even if advertised rates appear strong. Green Street highlights this dynamic:
The spread between [asking and effective rent] can reveal hidden softness in demand. Effective rents are often a truer reflection of cash flow expectations. [3]
For example, as of April 2025, the average U.S. office listing rate rose to $33.34 per square foot, marking a 5.4% increase year-over-year, even though vacancy rates climbed to 19%[6]. This discrepancy suggests that advertised rents may not fully reflect actual income levels. Concessions now account for 26% of U.S. office lease terms[6], showcasing short-term inconsistencies while also highlighting where certain asset classes may diverge in performance.
Ability to Highlight Supply-Demand Mismatches
Rent premiums across asset classes provide a clear view of concentrated demand. For instance, prime office rents are currently 84% higher than non-prime rents[6], driven by a "flight to quality" trend. Tenants are downsizing their overall footprint but opting for high-end, amenity-rich spaces.
Geographic variations further underscore supply-demand imbalances. In Northern New Jersey’s "last-mile" industrial hubs, such as the Meadowlands, asking rents hover around $17.00 per square foot, which is 20-25% higher than the regional average of $14.00 per square foot[15]. Meanwhile, properties located just 10 miles from Manhattan command rents that are 3.5 times the New York metro average[15]. These elevated rents highlight areas where tenant demand outpaces available inventory, signaling tight supply conditions.
Effectiveness in Evaluating Financial or Market Performance
Consistent rent growth is often a sign of a healthy market, reflecting tight supply, strong absorption, or higher replacement costs[3]. However, office properties lagged behind other commercial real estate sectors, showing only 0.7% rent growth[6]. By contrast, industrial rent growth has slowed to more sustainable mid-single-digit percentages annually, following the double-digit surges seen in 2021[13].
A useful metric for assessing market performance is Market Revenue per Available Foot (M-RevPAF), which combines rent levels and occupancy rates to provide a clearer picture of income potential[3]. A property with high asking rents but low occupancy will underperform one with moderate rents and stable tenancy. As Mike Watts, President of Investor Leasing at CBRE, explains:
Demand isn't just for premium finishes but also for convenience, accessibility, and locations that align with workforce needs. [6]
Applicability to Niche or Secondary Markets
Secondary markets often offer stronger rent-to-price ratios compared to overheated primary markets. For instance, Cleveland, Ohio, boasts a median home price of $139,900 and average rents of $1,555, creating one of the best rent-to-price ratios for investors in 2026[16]. This makes properties in such markets more likely to qualify for DSCR financing compared to oversupplied areas like Austin, where rent-to-price ratios have dropped below 0.55%[16].
Infrastructure investments also play a key role in driving localized rent growth. In Columbus, Ohio, rental vacancy rates remained low at 4.1% (compared to the national average of 6.8%) in early 2025. Average three-bedroom rents reached $1,738, largely fueled by Intel’s $20 billion semiconductor manufacturing investment[16]. Monitoring these types of developments can help pinpoint submarkets poised for accelerated rent growth before broader market trends catch up.
5. Sales Volume
Relevance to Identifying Underserved CRE Opportunities
Sales volume serves as a real-time gauge of market liquidity and investor sentiment. High transaction volumes typically reflect strong buyer interest, while low volumes often highlight pricing uncertainty and wider bid-ask spreads.
Focusing on transacted space - measured in square feet or units - rather than dollar amounts is key. This method avoids distortions caused by inflation or fluctuating construction costs. For example, retail properties demonstrated resilience in Q1 2024, with 87 million square feet transacted, a significant recovery compared to the 41 million square feet recorded in Q3 2020[17]. On the other hand, multifamily deal volume dropped sharply to around 108,000 units, marking its lowest point since 2010, excluding the immediate pandemic period[17]. By combining this metric with vacancy rates, absorption trends, and cap rate data, investors gain a clearer picture of market activity and transaction dynamics.
Effectiveness in Evaluating Financial or Market Performance
Tracking transaction volumes also highlights which sectors are attracting capital and which are under financial stress. For instance, U.S. commercial real estate transaction volume plummeted 43%, dropping from $1.14 trillion in 2022 to $647 billion in 2023[5]. This decline underscores the challenges of reconciling higher interest rates with seller price expectations.
If rates stay high and credit tight, transaction volume won't pick up until sellers, likely forced by their mortgage maturing, face the reality of the market-clearing price in today's environment.
– Xander Snyder, Senior Commercial Real Estate Economist, First American [17]
Historically, a narrowing bid-ask spread signals a recovery in transaction activity. As the Federal Reserve stabilizes its policy range at 3.75%–4.00% by early 2026[1][5], the market is transitioning from "rate shock" to focusing on capital strategies. This shift opens doors for buyers who can pinpoint areas where pricing has bottomed out.
Applicability to Niche or Secondary Markets
In secondary markets, large institutional acquisitions often validate opportunities that were previously overlooked. Additionally, owner-user transactions shed light on market stability. Submarkets with high owner-user activity typically experience longer hold periods and reduced volatility compared to areas dominated by short-term institutional trades[14]. By analyzing these patterns, investors can differentiate between fleeting capital flows and areas with genuine, long-term demand fundamentals.
6. Net Operating Income (NOI)
Relevance to Identifying Underserved CRE Opportunities
Net Operating Income (NOI) offers a critical perspective for spotting operational inefficiencies and untapped revenue in commercial real estate (CRE). Beyond metrics like vacancy and absorption rates, NOI helps uncover undervalued properties that may not be performing to their full potential. For example, in secondary markets such as Indianapolis, properties often sell below their true value because owners haven’t adjusted rents to match market rates or leveraged additional revenue sources like parking fees or rooftop leases [18]. By comparing a property’s NOI to submarket averages, investors can pinpoint performance gaps - cases where rents lag behind comparable properties, signaling opportunities for immediate improvement [2].
"In commercial real estate, NOI isn't just a number - it's a story. It tells you how well a property is performing and where there's room to grow."
– Cara Conde, Indianapolis Real Estate Agent [18]
Since sale prices are determined by dividing NOI by the cap rate, even small increases in NOI can lead to significant equity growth [18]. Identifying these gaps is the first step toward implementing strategies to cut costs or enhance revenue.
Effectiveness in Evaluating Financial or Market Performance
A key metric tied to NOI is the Operating Expense Ratio (OER), which should ideally stay below 80% [2]. An OER below this threshold signals efficient property management, reinforcing NOI as a reliable indicator of both current performance and future potential. Properties with higher OERs often point to operational inefficiencies rather than weak market demand. For instance, in 2025, digital tools like AI-powered lease abstraction uncovered over $1 million in missed escalation clauses, while energy management systems reduced energy consumption by 20%, directly improving NOI [2].
When analyzing NOI, it’s essential to exclude non-operating costs like mortgage interest and capital expenditures, as these can distort the true figure. Additionally, running worst-case vacancy scenarios can help investors identify potential risks before they become actual issues, especially in secondary markets [18].
Applicability to Niche or Secondary Markets
In emerging or secondary markets, low initial NOI can highlight properties with room for operational upgrades. Often, these properties underperform due to outdated facilities or poor tenant retention, even when demand is present [18]. One effective way to boost NOI in older buildings is through energy-efficient upgrades, such as modernizing HVAC systems or installing energy-saving lighting. These changes not only reduce operating expenses but also improve the property’s overall appeal [18][2].
A great example comes from Brookfield Properties, which introduced an AI-powered tenant app to streamline maintenance requests. Within six months, the app improved response times by 22% and increased tenant satisfaction by 12%, leading to better tenant retention and a more stable NOI [2].
It’s also worth noting that efficiency benchmarks vary by property type. For instance, industrial properties typically have OERs between 15% and 25%, while retail properties tend to fall within the higher range of 50% to 70% [2]. Understanding these benchmarks is crucial for tailoring strategies to different property types and markets.
7. Demographic Demand Drivers
Relevance to Identifying Underserved CRE Opportunities
Demographic trends are a powerful tool for predicting future demand in commercial real estate (CRE). Among these, net migration is particularly telling, as it reflects both the flow and volume of population changes - people tend to move where jobs are available [4]. For example, between 2020 and 2024, North Carolina welcomed over 573,000 new residents through net migration. Charlotte alone saw nearly 70,000 new residents during this time, cementing its status as one of the fastest-growing cities in the country. This population boom has fueled demand for multifamily housing, last-mile logistics facilities, and service-oriented retail in rapidly expanding areas [19]. These shifts not only highlight demand but also help pinpoint specific asset opportunities.
Looking ahead to 2030, the aging population is expected to significantly influence CRE needs. With baby boomers aged 65 and older making up a substantial portion of the population and one in five Americans retiring, new demands are emerging [20]. For instance, the trend of "aging in place" in suburban areas is creating a need for medical office buildings (MOBs), outpatient clinics, and senior-friendly mixed-use developments. Meanwhile, younger demographics are driving demand for urban multifamily housing and co-working spaces [19].
Ability to Highlight Supply-Demand Mismatches
Demographic data goes beyond just population numbers - it also includes income levels and job diversity, which are critical for understanding market potential. High-income areas tend to support premium retail and Class A office spaces, while lower-income regions are better suited for value retail and flexible industrial properties [19]. Tools like U-Haul migration data, Census reports, and job growth statistics can reveal emerging demand even before it impacts pricing [20].
"Demographic shifts are playing an integral role in reshaping CRE. Migration is redistributing populations to suburban communities... while aging is driving new forms of demand." [20]
Retail trends often follow residential growth. As suburban neighborhoods expand, demand rises for grocery stores, gyms, and urgent care centers alongside increasing residential density [20]. Industrial facilities are also in demand near growing populations to support last-mile delivery logistics. Meanwhile, office space demand is influenced by the migration of skilled workers and the clustering of professional industries [19]. In fact, demographic factors like household formation and population growth contribute to 30% of the "Demand Strength" score in CRE performance models [1].
Applicability to Niche or Secondary Markets
Secondary markets often reveal opportunities where demographic mismatches persist - gaps that may already be addressed in major metropolitan areas. Investors looking to tap into underserved niches can use neighborhood-level data, such as foot traffic and mobility patterns, to identify areas where retail demand outpaces supply [19]. In growing markets, retail centers anchored by essential services like pharmacies, grocery stores, and healthcare facilities tend to perform better than commodity retail options [20]. Additionally, markets with a diversified job base (spanning industries like tech, logistics, and healthcare) offer more stability and consistent demand than those dependent on a single employer [19].
"The suburbs are no longer sleepy areas. They have emerged into commercial hubs where residents of all ages live, work, shop, and receive care." [20]
Lifestyle trends, such as preferences for green spaces and integrated technology, also play a role in refining tenant mix strategies. These insights can help uncover niche CRE opportunities that align with evolving consumer expectations [19][20].
8. New Construction Pipeline
Relevance to Identifying Underserved CRE Opportunities
The construction pipeline provides a clear picture of how much new space will enter the market in the next one to three years. It’s typically divided into four stages: proposed projects, planned projects, projects under construction, and newly built properties in lease-up [4]. When demand is high, and the pipeline is thin, landlords often find opportunities to raise rents due to limited competition.
"Developers use void analysis before a single brick is laid. By identifying high-demand industries in a region, firms can plan construction projects that are specifically tailored to the needs of the local community – ensuring high occupancy rates from day one."
– Placer.ai [21]
For example, senior housing is experiencing its slowest inventory growth since 2006, with projected occupancy rates exceeding 90% by 2026. Meanwhile, high retail construction costs are keeping shopping center vacancies low - hovering around 5% [22]. These trends highlight gaps in supply that could present lucrative opportunities. This metric works hand-in-hand with other demand indicators, helping forecast potential market saturation.
Ability to Highlight Supply-Demand Mismatches
Comparing the construction pipeline to net absorption helps reveal whether demand is outpacing supply. Multifamily construction, for instance, has slowed significantly - starts are down 74% from the 2021 peak. By 2026, only 450,000 units are expected to be delivered, a sharp drop from the 700,000 projected for 2024 [22]. This slowdown suggests that markets absorbing heavy construction in 2023–2024 may face tighter conditions by 2027–2028.
However, not all regions are affected equally. Sunbelt cities like Austin, Charlotte, and Phoenix are still dealing with the effects of recent construction booms. Austin, for instance, saw its vacancy rate spike to a 20-year high of 10.01% in 2025 due to overbuilding, with 50%–65% of apartment communities offering six to eight weeks of free rent [16]. In contrast, cities in the Midwest and Northeast, where supply is more constrained, are benefiting from rising rents and better debt service coverage ratios [16].
Applicability to Niche or Secondary Markets
Secondary markets often reveal unique trends that differ from broader market dynamics. For instance, data centers in Northern Virginia are facing severe supply constraints, with wait times for new electricity connections exceeding five years [22]. Industrial real estate tells a similar story: while net absorption is expected to hit 224.9 million square feet in 2026, some areas are grappling with oversupply due to speculative development [22].
One key metric to watch is the "Development Hurdle Rate", which reflects the profit margin developers need to justify new projects [3]. High hurdle rates can limit new construction, benefiting existing property owners. In office markets, for example, new completions are expected to drop dramatically - down 73% from peak levels - with only 17 million square feet of new space forecasted for 2025, compared to the 10-year average of 44 million square feet [6]. This scarcity is driving tenants toward premium Class A buildings. Julie Whelan, Global Head of Occupier Research at CBRE, notes:
"Our prediction is that within a few years, [trophy buildings] will essentially be out of space."
[6]
9. Submarket Vacancy Variation
Relevance to Identifying Underserved CRE Opportunities
When examining commercial real estate (CRE) opportunities, focusing on submarket variations can reveal critical insights often hidden by headline vacancy rates. While national office vacancy stood at 19% in April 2025, with central business districts (CBDs) slightly higher at 19.2%, these averages fail to capture the dramatic differences between submarkets [6]. For instance, in Q1 2024, prime office spaces had a lower vacancy rate of 14.8%, which was 4.5 percentage points below non-prime spaces [6].
Julie Whelan, Global Head of Occupier Research at CBRE, highlights this disparity:
It's important to note that the 19% vacancy [in Q3 2024] is not spread evenly across markets. Major gateway downtown markets have been hit hardest, but even within those markets, the best quality space is often outperforming the overall market metric. It is a varied story market to market and even within submarkets.
[6]
In many cases, prime spaces outperform broader averages, with certain submarkets thriving due to specific anchors like hospitals, universities, or logistics hubs [14]. The high demand for quality spaces is reflected in rents for prime offices, which are currently 84% higher than those for non-prime spaces [6]. These variations make it clear that a closer look at submarkets is essential for uncovering actionable opportunities.
Ability to Highlight Supply-Demand Mismatches
Submarket-level trends often reveal a "flight to quality", where tenants favor premium spaces. For example, prime spaces saw an absorption of 49 million square feet, while non-prime spaces experienced a loss of 170 million square feet [6].
Regional disparities further emphasize this point. Miami led U.S. markets with a 15.5% vacancy rate, while Manhattan reported 16.2% in the Northeast [6]. Yet, even these city-wide figures obscure significant block-by-block or building-level differences. Economos DeWolf explains:
A headline vacancy rate or rental trend can mask significant differences block by block, or even building by building.
[14]
Local policies and infrastructure also shape submarket dynamics. For example, in Irvine, California, a cap increase of approximately 15,000 residential units removed marginal office inventory, tightening the remaining supply [14]. These localized constraints, often driven by policy rather than broader market trends, create opportunities that aggregate data cannot reveal.
Applicability to Niche or Secondary Markets
Secondary markets often rely on hyper-local factors that aren't visible in metro-level data. In Orange County, for example, the "Airport Area" benefits from high liquidity, while "Central County" is influenced by legacy infrastructure such as sports facilities and educational institutions [14]. These nuances are critical for accurate underwriting in both primary and secondary markets.
Mike Watts, President of Investor Leasing in the Americas at CBRE, underscores the importance of location-specific factors:
Demand isn't just for premium finishes but also for convenience, accessibility, and locations that align with workforce needs. Even newly constructed offices can sit empty if they fail to meet these criteria.
[6]
Submarket analysis can also pinpoint areas where local factors help preserve asset value. In some coastal secondary markets, hybrid tenants prioritize proximity to logistics hubs while favoring the workforce stability of suburban submarkets [14]. These micro-level dynamics, often invisible in broader data, can determine whether a property thrives or struggles.
Commercial Real Estate Market Analysis (Part 1): Step-by-Step LIVE Demonstration
How CoreCast Helps Analyze CRE Metrics
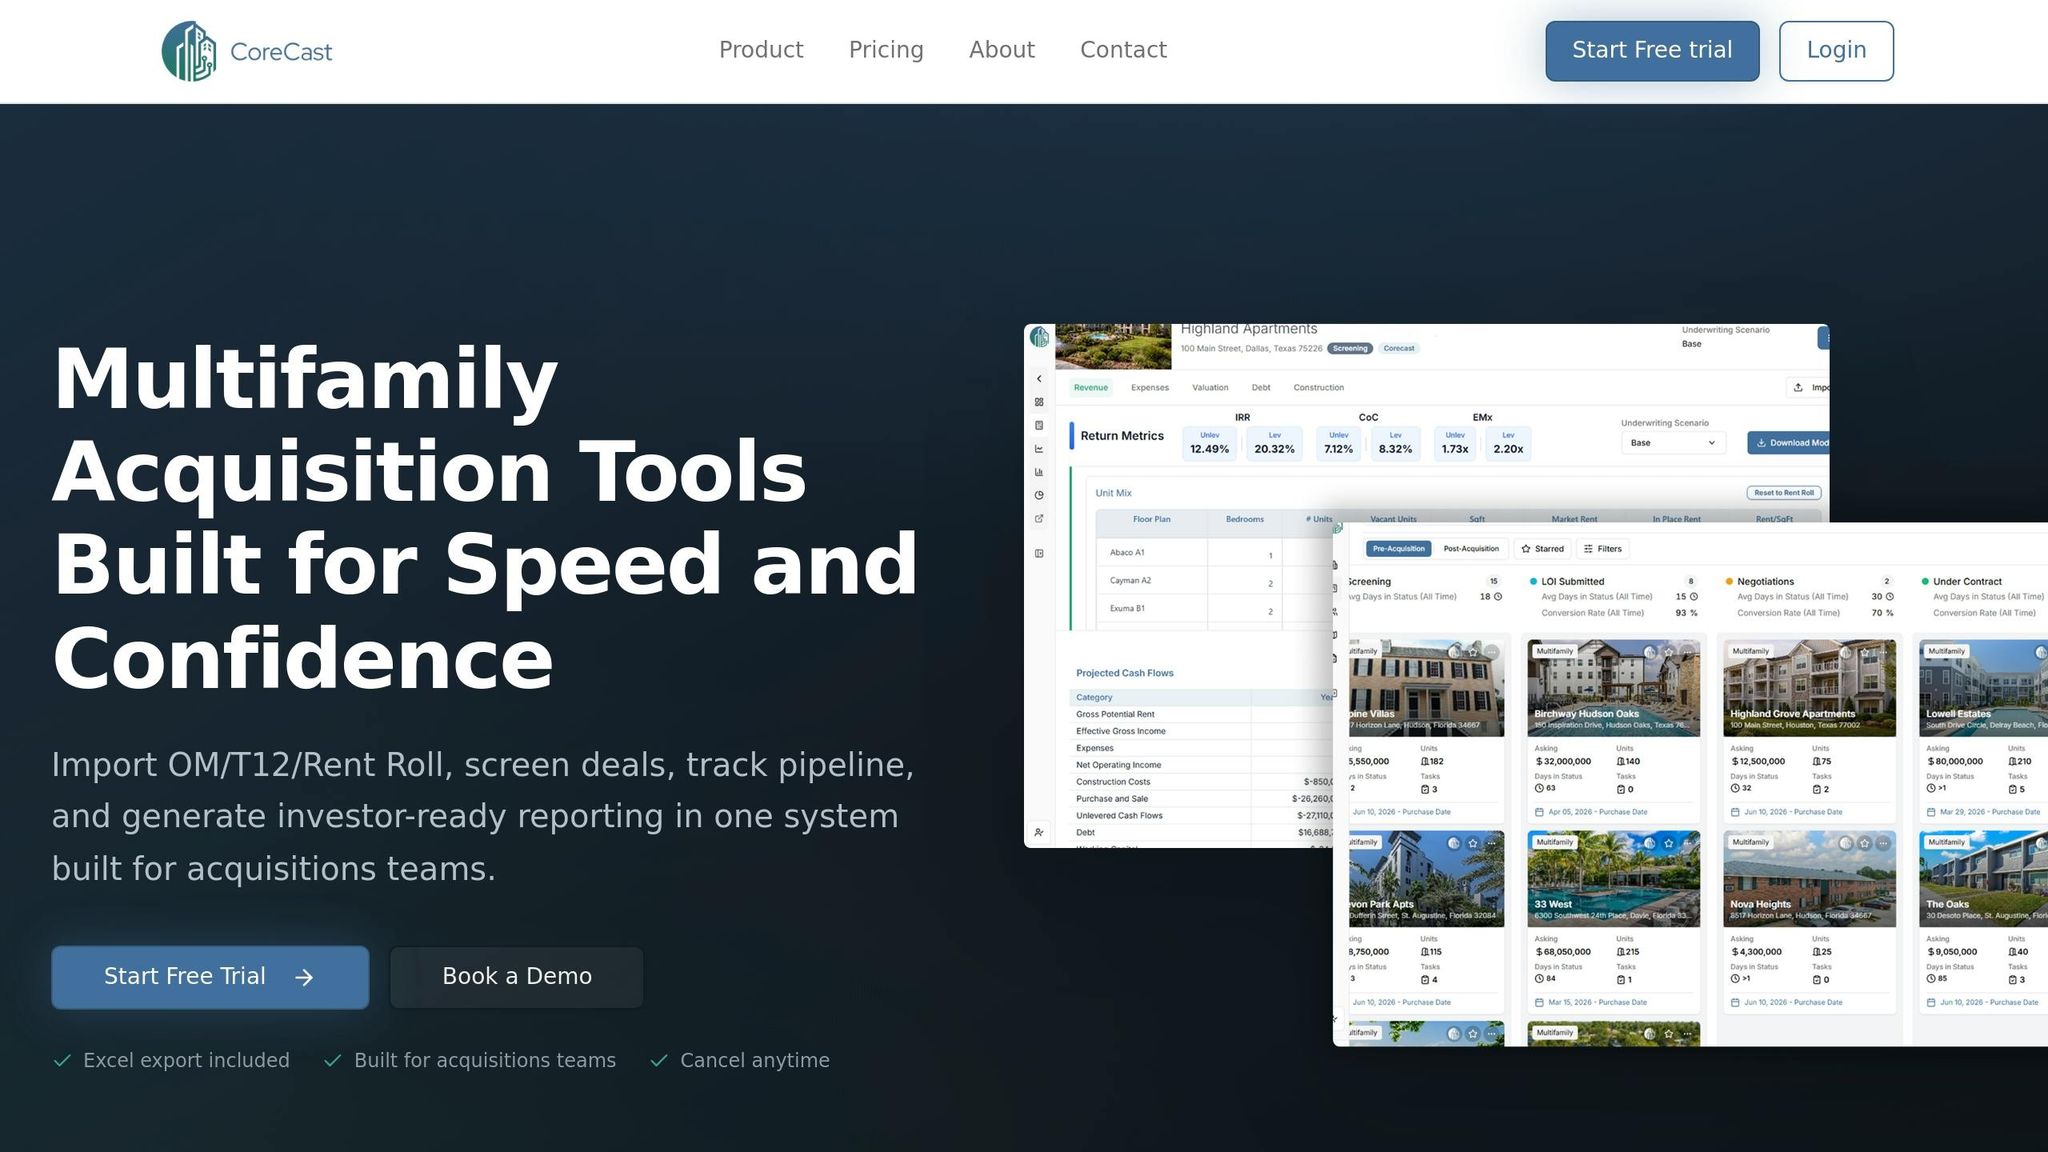
To make sense of the key CRE metrics outlined earlier, having the right tools is crucial. CoreCast, a real estate intelligence platform by The Fractional Analyst, simplifies this process by offering a comprehensive self-service solution. The platform tracks approximately 1.4 million properties, serves over 1,528 clients, and has facilitated 242,609 financial model downloads [23]. By consolidating data on metrics like cap rates and vacancy levels, CoreCast strengthens the analytical groundwork needed for effective decision-making.
One standout feature is the Market Comparison Tool, which allows users to compare metrics like cap rates, occupancy levels, and rental growth side by side [25]. This tool delivers real-time updates, replacing the weeks-long process traditionally required to gather similar insights. Professionals gain immediate visibility into critical metrics such as occupancy rates and lead-to-lease conversion rates [2][24].
Spencer Vickers, co-founder of The Fractional Analyst, highlights the platform’s versatility:
CoreCast enables asset underwriting, pipeline monitoring, competitive analysis via mapping, and portfolio review - all in one platform. [2]
The Integrated Mapping Feature is another game-changer. It overlays property data, demographics, and market trends onto geographic maps, uncovering hyper-local submarket gaps that aggregated data often misses [2][26]. For those assessing factors like demographic demand or new construction pipelines, this visualization offers a more precise understanding of market dynamics, leading to better positioning and quicker deal closures.
A Director of Acquisitions at a REIT shared their experience:
With the Pipeline Tracker, we reduced deal slippage by 30% over two quarters. The visibility and accountability it provides are game-changers. [27]
CoreCast also tackles a major industry pain point: inconsistent underwriting standards. Industry audits reveal that about 70% of lease files contain errors, but CoreCast’s AI-enabled automation reduces document error rates from 10% to under 1% [24]. This ensures standardized evaluations across asset types - whether office, retail, industrial, or multifamily - making it easier to compare opportunities on an "apples to apples" basis [2].
Currently in beta, CoreCast is priced at $50 per user per month, with a planned increase to $105 once fully launched.
Conclusion
Spotting underserved commercial real estate (CRE) segments takes more than just a hunch - it requires a structured analysis of key metrics. By digging into these metrics, you can pinpoint areas where demand outpaces supply. As Green Street emphasizes:
Knowing which commercial real estate metrics actually matter is what separates strategic investing from guesswork.
The real edge comes from acting quickly on these insights. For example, looking ahead to the 2026–2030 cycle, the Industrial sector shows a strong performance outlook with a score of 9.0/10, thanks to nearshoring trends. Meanwhile, the Office sector lags behind at 5.0/10, reflecting ongoing vacancy challenges [1]. These projections allow investors to focus on areas where long-term structural trends - like Build-to-Rent developments in suburban areas or energy-heavy industrial spaces near inland ports - are driving growth. This kind of data-driven approach leads to more targeted and actionable strategies.
Once you've identified an underserved segment, here’s what to do next: benchmark rental income and operating costs to identify performance gaps, assess local policies since factors like zoning changes or rent control can significantly impact returns [1], and look for upgrade opportunities that can add meaningful value to the property.
Platforms like CoreCast make this process even more efficient. With real-time insights on metrics like net absorption, new construction activity, and submarket performance, CoreCast helps professionals act fast. Priced at $50 per user per month during its beta phase, it offers the tools needed to transition from identifying opportunities to executing strategies before market conditions shift.
As the CRE market evolves, the global AI real estate market is on track to hit $41.5 billion by 2033 [2]. By combining thorough metric analysis with cutting-edge technology, professionals can stay ahead and make the most of underserved opportunities in this dynamic landscape.
FAQs
What metrics confirm demand is outpacing supply in a submarket?
Key metrics to watch are positive net absorption, occupancy rates exceeding break-even levels, and falling vacancy rates. These trends point to increased tenant demand relative to available supply, making it easier to spot areas in commercial real estate that may be underserved.
How can I avoid being misled by asking rents and headline vacancy rates?
To get a clearer understanding of market performance, it's crucial to look beyond asking rents and headline vacancy rates. Dive deeper into metrics like occupancy rates, market conditions, and historical trends. Consider factors such as lease expirations and shifting market dynamics to refine your analysis. Relying solely on headline figures can be misleading, but this comprehensive approach ensures a more accurate view of the market.
How can I use NOI and cap rates to spot undervalued value-add deals?
Net Operating Income (NOI) is a key metric for gauging a property's income potential, while capitalization rates (cap rates) help measure its return compared to market value. By analyzing how a property's income stacks up against its current or projected value, you can pinpoint opportunities where the income might indicate the property is undervalued. This makes it an appealing option for value-add investments.