
Cross-Border Real Estate: Transfer Pricing Basics

If related companies in two countries set the wrong price for a property deal, loan, or fee, the IRS can move income and apply a 20% penalty - or 40% in larger misstatement cases.
I’d boil this topic down to one rule: price related-party real estate deals the way outside parties would. That applies to property transfers, intercompany loans, management fees, development fees, leases, and IP or brand charges. The price has to match who does the work, who controls the risk, and where the activity happens.
Here’s the short version:
- U.S. Section 482 lets the IRS adjust related-party pricing
- OECD BEPS Action 13 uses Master File, Local File, and CbCR
- CbCR often applies when group revenue is above €750 million (about $830 million)
- Contemporaneous documentation should be ready by the tax filing deadline
- Common pricing methods include CUP, Resale Price, Cost Plus, TNMM, and Profit Split
- In CRE, tax reviews often focus on interest rates, management fees, rents, guarantees, and profit location
- For routine services, OECD guidance may allow a 5% cost markup in certain low-value service cases
- Market facts matter a lot in real estate, including rent levels, land values, lease terms, financing terms, and local conditions
What I take from the article is simple: the cleanest file is one where the contract, the numbers, and the business facts all match. If you set the structure early, pick the right method, and keep support in place before closing and filing, you cut tax risk.
The rest of the article breaks that into the core rules, the five pricing methods, and the documents you need for loans, fees, restructurings, and other cross-border CRE deals.
Industry Series: Transfer Pricing for Building, Construction, and Real Estate
sbb-itb-df8a938
The Core Rules: OECD, BEPS, and U.S. Transfer Pricing Standards

Two rule sets drive how cross-border real estate groups price intercompany deals: the OECD Transfer Pricing Guidelines and U.S. Section 482 regulations. At a high level, they aim for the same thing. The main gap is in how they handle documentation, enforcement, and penalties.
OECD Guidelines and BEPS Documentation Requirements
Under the OECD's BEPS Action 13 framework, multinationals need a three-tier documentation setup: the Master File, the Local File, and Country-by-Country Reporting (CbCR) [1].
The Master File gives tax authorities a group-level view of the business. It covers the overall structure, the nature of the business, and how profits are split across jurisdictions. The Local File gets much more specific. It focuses on entity-level transaction details and includes a functional analysis showing who does what in each deal.
CbCR applies to multinationals with consolidated revenue above €750 million, or about $830 million [1]. It gives tax authorities a jurisdiction-by-jurisdiction snapshot of profit, tax, and headcount. Put simply, it lets them see where income shows up and where people and business activity sit. Those documents also support the pricing method selected later.
How U.S. Rules Apply to Cross-Border CRE Structures
Under Section 482, the IRS expects controlled transactions such as management fees, rents, loans, and guarantees to produce results that line up with what unrelated parties would agree to [1]. That sounds simple on paper. In practice, it's where many groups get squeezed.
The Best Method Rule says taxpayers must use the method that gives the most reliable measure of an arm's length result, not the one that's easiest to apply [2]. So if one method is more work but gives a better answer, that's the one the IRS expects.
Timing matters too. Documentation has to be contemporaneous, which means prepared by the filing deadline, not pulled together after an audit starts [1]. Miss that step, and the cost can sting. The IRS may impose a 20% penalty on transfer pricing underpayments, and that can jump to 40% for gross valuation misstatements [1].
For cross-border CRE groups, the IRS pays close attention to related-party management fees, rents, and interest rates. Those are common pressure points, and they tend to get reviewed closely.
Location-Specific Advantages in Real Estate
Real estate is local by nature. A property in Manhattan does not behave like one in Phoenix, and neither looks like a site in London or Singapore. That's why comparability often turns on market-level facts, not just broad asset categories.
Under OECD guidance, location-specific advantages (LSAs) - the economic gains tied to operating in a given market - need to show up in how profits are allocated between related entities [1]. In plain English, if one market gives a project better rent levels, stronger land appreciation, or more favorable development economics, that can affect how returns should be split.
For real estate groups, that usually means local rental markets, land values, and project economics matter a lot. Market-specific data helps support comparability and the allocation of returns [1].
These rules shape which pricing method fits the deal.
Choosing a Transfer Pricing Method for Real Estate Transactions
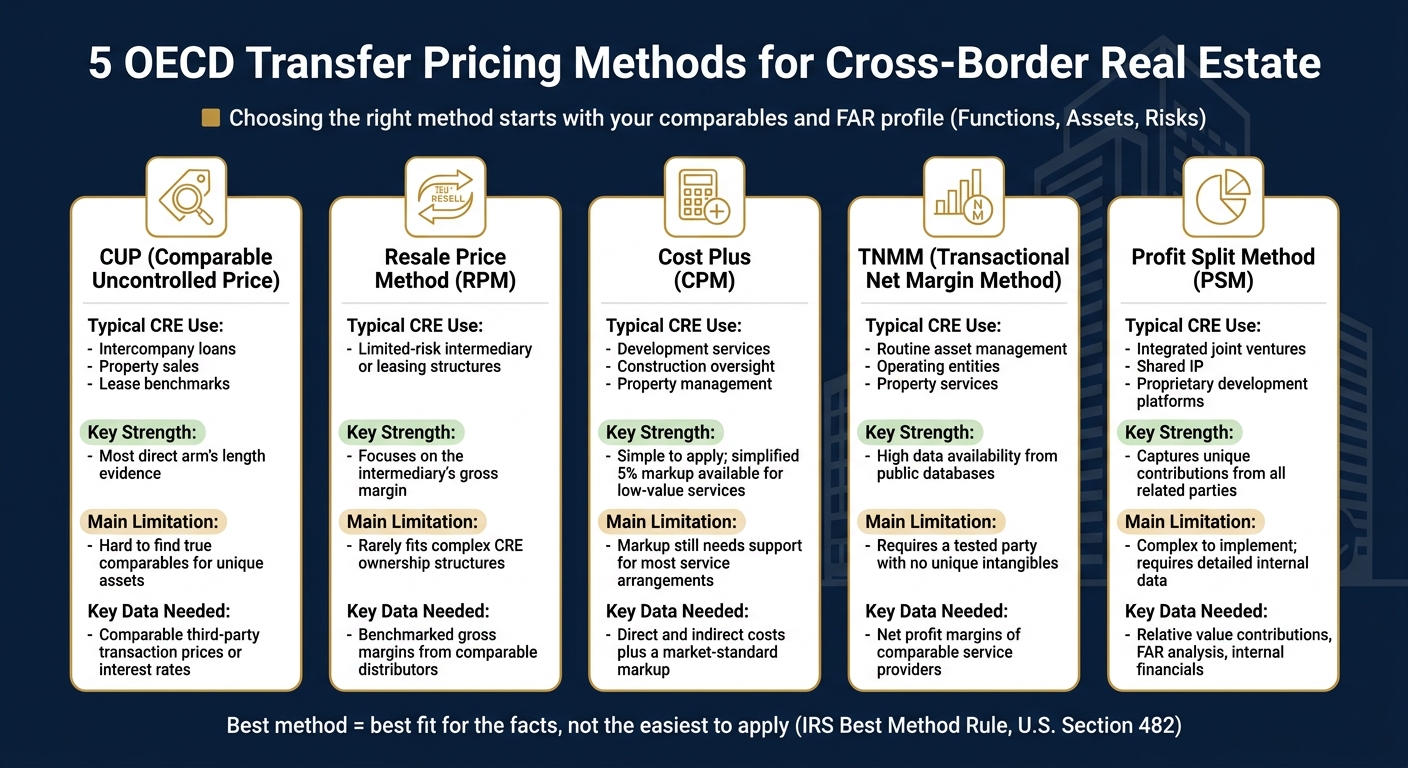
5 OECD Transfer Pricing Methods for Cross-Border Real Estate
Real estate deals are local, asset-specific, and often hard to match with clean market comps. That’s why method selection usually starts with one basic question: what comparables do you actually have?
The OECD sets out five methods, and the right one is the one that fits the facts best. In practice, that means looking at the deal itself, the quality of the available comparables, and each party’s functions, assets, and risks. That FAR profile is what drives the choice.
Traditional Transaction Methods: CUP, Resale Price, and Cost Plus
The Comparable Uncontrolled Price (CUP) method is the most direct option. It compares the intercompany price to the price unrelated parties would charge in the same or a very similar deal.
For cross-border CRE, CUP can work well for related-party loans. You look at the borrower’s standalone credit rating and then benchmark the interest rate against similar third-party debt instruments. It can also work for property sales or lease deals when there are real market comparables. That said, real estate doesn’t make life easy here. Every asset has its own wrinkles, so true comparables are often hard to find.
The Resale Price Method (RPM) looks at the gross margin earned by an intermediary that buys from a related party and resells to third parties. In CRE, that usually means it fits only narrow cases, such as limited-risk intermediary or leasing setups.
Cost Plus is the go-to method for routine services. If one related entity provides development services, construction oversight, property management, or similar support, the usual approach is to add a benchmarked markup to the costs incurred. For low-value-adding routine services, the OECD allows a simplified 5% markup on costs without a detailed benchmarking study [1]. That makes it a practical option for routine intercompany services.
Profit-Based Methods: TNMM and Profit Split
The Transactional Net Margin Method (TNMM) tests the net profit margin of the simpler party in the deal. That’s usually the entity handling routine functions and not owning any special intangibles.
Why does TNMM show up so often? Simple: the data is often easier to get. Public databases usually provide comparable financial data more easily than the transaction-level pricing data needed for CUP. So if you’re dealing with routine operating entities, asset managers providing standard services, or property management companies, TNMM is often a strong fit.
The Profit Split Method (PSM) comes at the issue from the other side. Instead of testing one party on its own, it looks at the combined profit from the transaction and then splits that profit based on each party’s relative contribution.
This method tends to make more sense when more than one related party brings something special to the deal, like specialized development technology or global brands, and no single entity can cleanly serve as the simpler tested party. PSM is harder to run. It needs detailed internal data and more judgment. But for highly integrated cross-border multifamily joint ventures, it can be the most defensible route.
Method Comparison Table for Common CRE Use Cases
| OECD Method | Typical CRE Use | Key Strength | Main Limitation | Key Data Needed |
|---|---|---|---|---|
| CUP | Intercompany loans, property sales, lease benchmarks | Most direct arm's length evidence | Hard to find true comparables for unique assets | Comparable third-party transaction prices or interest rates |
| Resale Price (RPM) | Limited-risk intermediary or leasing structures | Focuses on the intermediary's gross margin | Rarely fits complex CRE ownership structures | Benchmarked gross margins from comparable distributors |
| Cost Plus (CPM) | Development services, construction oversight, property management | Simple to apply; simplified 5% markup available | Markup still needs support for most service arrangements | Direct and indirect costs plus a market-standard markup |
| TNMM | Routine asset management, operating entities, property services | High data availability from public databases | Requires a tested party with no unique intangibles | Net profit margins of comparable service providers |
| Profit Split (PSM) | Integrated joint ventures, shared IP, proprietary development platforms | Captures unique contributions from all related parties | Complex to implement; requires detailed internal data | Relative value contributions, FAR analysis, internal financials |
Taken together, these methods cover most CRE setups. The hard part isn’t knowing the menu. It’s dealing with the moments where the clean textbook fit starts to fall apart - and making sure the file explains why your method still makes sense.
Common Risk Areas and Documentation for Cross-Border CRE
After method selection, the next issue is proof. Your file needs to show that the facts, contracts, and economics line up. It also needs to show how each party earns its return.
Where Real Estate Groups Commonly Misprice Intercompany Arrangements
The usual problem isn't overly high or low pricing. It's profits booked in the wrong entity - when income lands in an entity that doesn't control the functions or risks that produce it.
In cross-border CRE structures, this tends to show up in a few repeat trouble spots. Management or asset fees may be charged without proof that the services were actually performed or that the fee matches market terms. Intercompany loans may carry interest rates that ignore the borrower's standalone credit profile, which means the rate reflects implied group support instead of what an outside lender would charge. And with brands or other intangibles, returns may be assigned to the legal owner even when another entity is the one doing and controlling the development, protection, and exploitation work that creates the value.
What a Defensible Comparability Analysis Looks Like
A solid study starts with FAR and then adjusts for location, lease profile, property type, financing terms, and local market conditions. The practical test is straightforward: price the deal the way unrelated parties would.
Documentation Checklist for Deals, Services, and Financing
Use the checklist below to turn the analysis into audit-ready support. These are the CRE arrangements most likely to attract scrutiny.
| Transaction Type | Required Documentation | Key Alignment Focus |
|---|---|---|
| Intercompany Loans | Standalone credit rating assessment, loan agreement, interest rate benchmarking against comparable third-party debt | Interest rate must reflect the borrower's own credit risk, term, and currency - not implicit group support [1] |
| Management / Asset Fees | Service agreements, cost allocation schedules, time logs, cost-plus or TNMM benchmarking | Evidence that services were actually rendered and provided measurable value; routine low-value services may qualify for a simplified 5% markup if they meet the documentation requirements [1] |
| IP or Brand Licensing | Royalty benchmark or brand valuation, analysis of who performs the development, protection, and exploitation work | Returns should follow who controls value-creating functions, not just who holds legal title [1] |
| Business Restructuring | Valuation of rights transferred, exit charge analysis, functional shift documentation | Arm's length compensation for relinquished functions, assets, or risks [1] |
| Master File / Local File / CbCR | Master File, Local File, and CbCR as applicable | Local file requirements vary by jurisdiction [1] |
Contemporaneous documentation is the main defense in an audit.
Applying the Basics in Practice and Key Takeaways
Steps for Structuring Cross-Border Real Estate Transactions
Get transfer pricing right before closing, not after. Start by mapping the entities, transactions, functions, assets, and risks. Then choose the method, benchmark it, and document it before filing.
That sequence matters. Structure drives method selection, and method selection drives documentation. If documentation is late or missing, penalty defenses get weaker.
How Financial Modeling Supports Transfer Pricing
Financial models make this process easier to test. A solid underwriting model checks the assumptions behind arm’s length pricing. It helps show whether cash flows, rents, and capital structure line up with the pricing method you chose.
Conclusion: Key Points to Carry Forward
In practice, the strongest file is often the simplest one: the facts, the method, and the documentation all point in the same direction.
Cross-border CRE transfer pricing comes back to one rule: align price, function, and risk. Use the right method, document it early, and keep the economics in line with the contracts.
FAQs
How do I choose the best transfer pricing method?
Choose the best method based on the transaction and on what you can benchmark with confidence.
Use CUP when you have comparable uncontrolled prices. Use RPM for limited-risk distribution. Use Cost Plus for routine services or manufacturing. Use TNMM when you have solid financial comparables. Use Profit Split when both sides contribute unique, valuable intangibles or when the deal is highly integrated.
Then document both your method choice and your benchmarking with contemporaneous records that show an arm’s-length result.
What documents should be ready before filing?
Before you file your U.S. tax return, make sure your contemporaneous transfer pricing documentation is ready. In most cases, that means a BEPS Action 13-style package with:
- a business and organizational overview
- descriptions of controlled transactions
- the selected method and how you applied it
- economic analysis and benchmarking
- an index of supporting documents
If the entity meets the filing threshold, you should also have the Master File, Country-by-Country Report, and any Local File that applies to that entity.
When does a related-party real estate deal trigger IRS penalties?
It can trigger IRS transfer-pricing penalties if the IRS adjusts the pricing under IRC Section 482 and that adjustment leads to an underpayment of tax.
In most cases, the penalty is 20% of the underpayment. That can jump to 40% for gross valuation misstatements, such as when the reported value is at least 200% of the arm’s-length amount.
If contemporaneous documentation is missing, the taxpayer may also lose the reasonable-cause and good-faith defense.