
Top 10 Errors in Financial Models
Financial models are essential for making informed decisions in commercial real estate and other industries. But even small mistakes can lead to costly consequences. Here’s a quick summary of the 10 most common errors in financial models and how to avoid them:
Wrong Formulas and Math Errors: Mistakes in formulas, like incorrect cell references or arithmetic errors, can quietly disrupt entire models.
Fix: Double-check formulas, simplify calculations, and use Excel’s auditing tools.Data Entry Mistakes: Typos or inconsistent formatting can ripple through calculations.
Fix: Use standardized templates, dropdown menus, and automated data imports.Old or Wrong Assumptions: Outdated or overly optimistic assumptions can skew results.
Fix: Regularly update assumptions and base them on current, accurate data.Too-Optimistic Projections: Unrealistic forecasts create false expectations.
Fix: Conduct sensitivity analysis and compare projections with benchmarks.Poor Documentation and Hidden Calculations: Lack of clarity makes models hard to audit and understand.
Fix: Document assumptions clearly, use consistent formatting, and group related data.Messy Formatting and Layout: Disorganized models reduce trust and usability.
Fix: Use consistent colors, fonts, and layouts to create professional, readable models.Broken Links and Bad References: Missing or outdated links can lead to incorrect outputs.
Fix: Minimize external links, use named ranges, and regularly check references.No Error Checking or Model Testing: Hidden errors can go unnoticed without proper testing.
Fix: Build error-checking formulas, conduct peer reviews, and leverage Excel tools.Overly Complex Models: Intricate models are harder to maintain and prone to errors.
Fix: Focus on key drivers, simplify calculations, and avoid unnecessary details.Missing Sensitivity Analysis: Ignoring uncertainty can mislead decision-making.
Fix: Test scenarios with varying inputs and visualize outcomes for better insights.
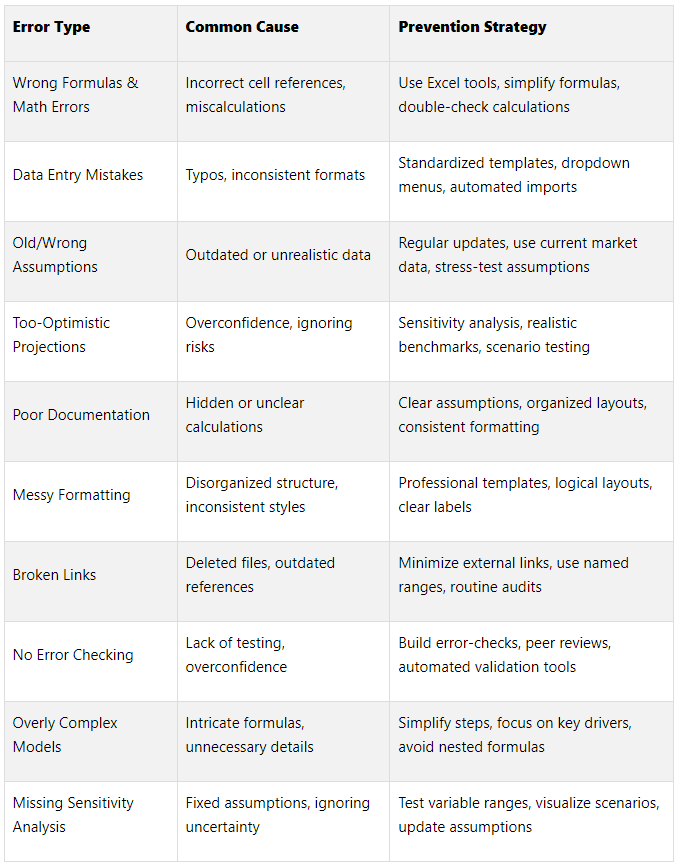
Quick Comparison Table
Ten Strategies to Reduce Errors in Financial Models
1. Wrong Formulas and Math Errors
Mistakes in formulas can quietly sabotage financial models. These errors are not only common but also difficult to detect, and once they occur, they can ripple through a model, potentially affecting millions of dollars in investment decisions.
Studies reveal that around 94% of spreadsheets contain errors, which raises serious concerns about their reliability [2]. Ruth McKeever highlights this issue:
“The reliability of a spreadsheet is essentially the accuracy of the data that it produces, and is compromised by the errors found in approximately 94% of spreadsheets.”
Some typical formula errors include incorrect cell references, arithmetic miscalculations, and rounding inaccuracies that gradually distort a model's outcomes. Even small mistakes, like missing parentheses or creating circular references, can throw off the entire model.
A striking example of this was in 2000, when errors in the "Gaussian Copula" risk model played a role in poor loan decisions, contributing to the 2008 financial crisis [1].
How to Prevent Formula Errors
Double-check formulas: Always review every formula before finalizing your model. Use Excel's built-in auditing tools to trace precedents and dependents, ensuring each formula references the correct cells. For example, the Trace Precedents feature (Alt + M + P) can help you verify connections.
Simplify your formulas: Complex, multi-step formulas are more prone to errors. Break them down into smaller, more manageable pieces. This approach makes troubleshooting and verification much easier.
Collaborate: A second pair of eyes can make all the difference. After spending hours working on a model, it’s easy to miss mistakes. Ask a colleague to review your work for errors you might have overlooked.
Use Excel tools: Excel has features like Ctrl+~ to toggle between showing formulas and their outputs, making it easier to spot hidden formulas that might be mistaken for hard-coded values. Additionally, Excel’s error-checking functions can flag issues like #DIV/0!, #VALUE!, and #REF! errors before they cause larger problems.
2. Data Entry Mistakes
Manual data entry can be a major weak spot in financial modeling. Every keystroke carries the potential for errors that ripple through calculations, distorting projections and skewing risk assessments. These mistakes, like formula errors, can significantly impact outcomes.
Data entry errors are a persistent issue, second only to formula mistakes in terms of risk. And they’re costly. Poor data quality costs businesses an average of $9.7 million annually [3], while bad data drags down the U.S. economy by more than $3 trillion each year [5]. One striking example? Hawaiian Airlines once mistakenly charged $674,000 per ticket by incorrectly converting 674,000 miles into dollars. The result? Billing chaos and plenty of unhappy customers [3].
The Most Common Data Entry Errors
Transcription errors: These happen when numbers are manually copied from one source to another, leading to inaccuracies that throw off calculations.
Unit inconsistencies: Mixing different scales or units - like thousands versus full dollar amounts or varying measurement standards - can create confusion, especially in real estate or financial models.
Incomplete entries: Missing fields or undocumented assumptions compromise the reliability of sensitivity tests and overall analysis.
How to Prevent Data Entry Mistakes
The best way to tackle data entry errors is to stop them before they happen. Here’s how:
Standardized templates: Use templates with built-in data validation to catch errors at the source. For instance, set constraints to accept only valid date formats or numbers within a specific range.
Dropdown menus: Replace manual typing with dropdown menus for predefined options, like property types or categories. This reduces the chance of typos and ensures consistency.
Automated imports: Integrate ERP systems and financial databases using APIs or connectors. Automating data imports minimizes manual input, slashing the risk of human error.
Here’s a real-world example: During an internship at WEX, an analyst found that using standardized templates and documenting processes not only caught common mistakes but also improved efficiency. These measures boosted accuracy and sped up workflows by 15% [4].
Ultimately, prevention is far cheaper and more effective than fixing errors after the fact. Consider this: leaving a single data error unresolved could cost over $100 to correct down the line [5]. A proactive approach can save both time and money.
3. Old or Wrong Assumptions
Just like errors in formulas or data entry, incorrect assumptions can seriously undermine a financial model's reliability. These models rely heavily on accurate inputs, and when assumptions are outdated or incorrect, they can destabilize the entire structure. The stakes are high - over 50% of businesses fail within their first three years due to poor financial management[8]. Many of these failures trace back to flawed assumptions.
When assumptions are wrong, they can skew calculations across the board, impacting decisions related to capital raising, growth strategies, and cash flow management.
Key Assumption Errors
One major issue is relying on stale market data. Markets change constantly, but analysts often use outdated information that no longer reflects reality. For instance, interest rates or inflation figures from six months ago might be irrelevant today, leading to flawed conclusions.
Another common mistake is making overly optimistic projections. For example, inflated rental income assumptions might ignore current market challenges[7]. Underestimating vacancy rates or tenant turnover can create models that look great on paper but fail when applied in real-world scenarios.
Using generic industry benchmarks without considering local context is also risky. What works for a retail property in Manhattan might not apply to one in rural Kansas. Such blanket assumptions can lead to inaccurate revenue forecasts and misguided strategic plans.
Real-World Impact of Flawed Assumptions
The ripple effects of bad assumptions go beyond just flawed numbers - they can derail critical decisions. For instance, altering a revenue growth assumption from 8% to 12% once boosted projected revenue by $4 million. This single change influenced decisions around funding, hiring, and overall strategy[10].
Kalor Lewis, VP of Finance at Fivetran, highlights the importance of understanding the business deeply when building financial models:
“Building an effective financial model requires a really strong bottom-up understanding of the business... You need to know what the sales capacity model looks like, how the marketing team spends its budget, and how the company makes money. Getting that understanding requires deep collaboration with leaders across the company.”
Keeping Assumptions Current and Accurate
It's not enough to get assumptions right initially - they need to stay accurate over time. Financial models should be updated at least once a year, or more often if conditions change frequently[11]. Establishing regular review cycles and gathering input from informed stakeholders ensures your model stays relevant.
Rather than relying on a single source, base your assumptions on multiple data points. Combine historical performance data with updated market research, industry benchmarks, and your company’s strategic plans. For real estate models, digging into local market conditions and consulting experts can help create realistic estimates[7].
Finally, stress-test your assumptions using sensitivity and scenario analyses. Even small changes in key inputs can significantly impact your model's results. Understanding these dynamics helps you prioritize which assumptions need the most attention and regular updates. By continuously refining your assumptions, you build a model that supports sound, data-driven decisions.
4. Overly Optimistic Projections
Errors in formulas and assumptions can derail financial models, but overly optimistic projections pose an equally significant risk. These inflated forecasts often set unattainable goals, misleading investors and creating unsustainable expectations. Unlike outdated assumptions, overly optimistic projections tend to overestimate future revenues while ignoring real-world market constraints.
Unrealistic revenue expectations are often rooted in unchecked growth assumptions and a failure to account for market dynamics [10]. Let’s break down the signs and causes of these overly optimistic forecasts.
Common Signs of Unrealistic Projections
Several warning signs can indicate that projections have veered into unrealistic territory:
Revenue per employee exceeding reasonable thresholds (e.g., more than $1 million) or forecasts that surpass the market's realistic size suggest aggressive assumptions [13].
Assuming new sales staff or partners will deliver immediate results, while underestimating the time required for onboarding and sales cycles, can lead to gaps in revenue recognition [10] [13].
The Psychology Behind Optimistic Bias
Optimism in forecasting isn’t always rooted in technical missteps - it’s often influenced by psychological factors. Analysts may project short-term successes into the future without considering potential market saturation, changing consumer preferences, or broader economic shifts. Overconfidence in past trends can lead to significant forecasting errors [14].
Building Realistic Revenue Models
To avoid the pitfalls of overly optimistic projections, it’s crucial to ground revenue forecasts in actual market conditions. Compare your estimates against the market's true size and industry benchmarks [13]. Additionally, include a realistic ramp-up period for new sales representatives or partners to reflect the time it takes for them to reach full productivity [13].
Stress-Testing Your Projections
Stress-testing is a valuable tool for assessing the resilience of your revenue assumptions. Use sensitivity and scenario analyses to explore different outcomes, such as base, best, and worst-case scenarios [10] [14]. This approach helps highlight how market changes or competitive pressures could impact your forecasts [14]. A pre-mortem analysis can also uncover hidden vulnerabilities in your model [12].
Maintaining Model Accuracy Over Time
Financial models aren’t static; they need regular updates to stay relevant. Continuously refine your models by comparing forecasts with actual performance to identify discrepancies [12]. Cross-checking key performance indicators against industry averages can further ensure that your assumptions remain aligned with reality [12].
5. Poor Documentation and Hidden Calculations
Mistakes in formulas and data entry are bad enough, but poor documentation takes the problem to another level, chipping away at the reliability of financial models. A model without clear documentation becomes a mysterious "black box", leaving stakeholders guessing about the calculations that drive critical decisions. When key assumptions are buried in convoluted formulas or left unexplained, even the most advanced models can lose their credibility and fail to support effective decision-making.
Good documentation does more than clarify a model's logic - it directly impacts productivity. Poor documentation isn't just inconvenient; it’s a serious drain on resources. In fact, documentation issues contribute to over 21% of productivity losses in organizations [17]. Worse yet, unclear documentation can weaken a company’s position in legal disputes or contractual negotiations [15]. When team members can’t quickly grasp a model’s logic, they’re forced to spend time reverse-engineering calculations instead of focusing on strategic insights. This can lead to delays in approvals and costly decisions based on misunderstood assumptions.
Hidden calculations make matters even worse, as they obscure potential risks that could disrupt financial projections. A risk manager from a large Global Macro Hedge Fund put it bluntly:
“Anything that can hurt my portfolios and I am in particular looking out for the things that have not yet happened or that I have not yet imagined.”
Common Documentation Pitfalls
Many financial analysts unintentionally create documentation headaches by embedding assumptions directly into formulas, using vague cell references that lose meaning over time, or crafting overly complex formulas that try to do too much in one cell. These practices make models harder to understand, audit, and update.
Transparency is key. Experts in financial modeling stress the importance of documenting assumptions and methodologies clearly. Well-documented models are easier to explain, defend, and revise. Without this structure, hidden errors can creep in, undermining the entire model.
Building Transparent Models
A great starting point for transparency is organizing your model effectively. For instance, create a dedicated "Assumptions" tab to separate key inputs from calculations [18]. Use consistent color-coding to make it easy for users to navigate - blue for inputs, black for formulas, and green for links to other sheets [19].
Instead of cramming multiple calculations into a single cell, break them into smaller, manageable steps. Follow the "one row, one formula" rule [19]. Reference clearly labeled assumption cells to ensure every input is traceable, and document the reasoning behind each one. For example, if an FP&A analyst adjusts revenue growth from 8% to 12% due to a product expansion, that rationale should be explicitly noted for anyone reviewing the model [10].
Making Models Audit-Ready
To make your model easier to audit, include an instruction tab that walks new users through its structure [18]. Use comments and footnotes liberally to explain complex calculations or unique assumptions. Instead of hiding rows or columns, group them to keep all data visible while maintaining organization [18].
Finally, add a dedicated tab for error checks that aggregates issues across the entire model [19]. Improving documentation isn’t just a "nice-to-have" - it’s as crucial as getting the calculations right. A transparent and well-documented model ensures that financial analysis is both reliable and actionable.
6. Messy Formatting and Layout
Even the most accurate calculations can lose their impact if a financial model looks chaotic. Misaligned columns, inconsistent fonts, or clashing color schemes can make decision-makers question the analyst's precision before they even dive into the numbers. A clean, well-organized layout not only builds confidence but also makes error-checking - discussed earlier - much more effective.
The Hidden Costs of Inconsistent Formatting
Formatting issues aren't just an eyesore - they create actual headaches. Imagine revenue figures shown with currency symbols in one section but as plain numbers in another. Users waste precious time trying to interpret these discrepancies. Or consider date formats that vary throughout the model, or decimal places that aren't consistent. These small inconsistencies can turn a straightforward model into a frustrating puzzle, eroding trust in the data.
Building Professional, Consistent Models
To avoid these pitfalls, stick to formatting practices that boost both clarity and credibility. Here are a few key tips:
Use a consistent color scheme: For example, blue for hardcoded inputs and black for formulas. This makes it easier to identify cell types at a glance.
Standardize typography and number formats: Keep fonts, currency symbols, and decimal places uniform. Use brackets for negative numbers and always include unit labels where relevant.
Emphasize key elements: Highlight titles and sum totals with bold text to create a clear visual hierarchy.
Organizing for Maximum Clarity
Beyond formatting, a logical structure makes your model easier to navigate and understand. Start with a clear layout that might include a cover sheet, summary, assumptions and inputs, and detailed calculations. Use descriptive worksheet names like "Revenue Assumptions" instead of generic ones like "Sheet1." Within each worksheet, group related data with borders and spacing, remove gridlines for a polished look, and use Excel’s grouping features to collapse detailed sections. Avoid merging cells, as it can complicate formulas and navigation - opt for "center across selection" instead.
For added usability, include a table of contents with hyperlinks for quick navigation. The goal is to design your financial model to resemble a professional financial statement, with clear titles, consistent formatting, and a logical flow that guides users effortlessly through your analysis.
Transform Your Real Estate Strategy
Access expert financial analysis, custom models, and tailored insights to drive your commercial real estate success. Simplify decision-making with our flexible, scalable solutions.
7. Broken Links and Bad References
Broken links can wreak havoc on financial models, turning one small error into a chain reaction of inaccuracies. These mistakes often fly under the radar, making your model look fine on the surface while delivering completely incorrect results. Let’s dive into how Excel tools can help identify and fix these hidden issues.
The Hidden Dangers of Reference Errors
Reference errors can undermine your model's reliability in several ways. For instance, #REF! errors pop up when formulas point to deleted cells or ranges, while #VALUE! and #NAME? errors signal problems with data types or formula syntax. External links to files that have been moved or renamed can also return outdated values, making errors harder to spot.
Here’s an example: Imagine you’re working on a three-statement model, and a critical revenue component is stored in a hidden row. If that row is accidentally excluded from subtotals because of a broken reference, the error can ripple through your income statement, balance sheet, and cash flow projections, derailing your entire analysis.
Excel's Built-in Detective Tools

Excel includes several tools to help you catch and fix reference issues before they spiral out of control:
Trace Precedents and Trace Dependents (found in the Formulas tab) let you track which cells feed into or rely on a specific cell.
The Edit Links feature (in the Data tab) shows all external connections, making it easy to update file paths, remove invalid links, or convert external references into static values.
Find and Replace (Ctrl + F) can help locate lingering external references, such as ".xl" fragments, within your formulas.
These tools are invaluable for spotting potential problems and ensuring your model stays accurate.
Prevention Through Smart Model Design
The best way to avoid broken references is to build a strong, well-organized model from the start:
Keep worksheet structures consistent. For example, always place revenue assumptions in the same column (e.g., column C) to make formulas easier to follow.
Regularly unhide rows and columns (Alt + H, O, U) to ensure no critical data is overlooked.
Minimize external links by importing data as hard-coded values and updating them manually. This reduces the risk of broken external connections.
Use named ranges instead of absolute cell references for better clarity and fewer errors.
Routine audits are also crucial. After making any structural changes, review all formulas and check the Name Manager in the Formulas tab for named ranges that might reference deleted areas or external files. This proactive approach ensures your model remains accurate and reliable, meeting the high standards decision-makers expect.
8. No Error Checking or Model Testing
Once you've tackled formula issues, data entry mistakes, and formatting glitches, the next step is to incorporate error-checking and model testing into your financial model. Without these safeguards, financial models are left vulnerable to hidden errors that can snowball into serious problems. In fact, nearly 59% of controllership professionals report multiple financial reporting errors each month, and about one-third encounter errors weekly [23]. The consequences of such mistakes can be catastrophic. Take JPMorgan Chase's 2012 "London Whale" incident, for example - Excel spreadsheet errors contributed to losses exceeding $6 billion [24].
“The reality is that anyone who has worked in a spreadsheet is not immune to the possibility of errors due to its flexibility which is both a blessing and a curse at the same time.”
Building Error-Checking Formulas Into Your Model
A proactive way to avoid errors is to embed error-checking formulas directly into your model as you build it. These checks act as guardrails, catching faulty logic or mistakes early on. Additionally, alert checks can flag unusual entries, such as negative revenues or breached debt covenants, that may require further investigation [20].
Here are some examples of useful error-checking formulas:
Balance sheet alignment:
=IF((C3-C5-C7)<>0, C3-C5-C7, 0)ensures that assets (C3) equal the sum of liabilities (C5) and equity (C7).Error detection:
=IF(ISERROR(C6-C10), 1, )identifies calculation errors between Net Assets and Total Equity.Layered validation:
=IF(C12<>0, 0, (ROUND(C6-C10, 5)<>0)*1)first checks for initial errors and then confirms that Net Assets match Total Equity.
By integrating these types of checks, you can maintain a model that’s both accurate and dependable for critical decision-making.
Implementing Peer Reviews and Collaborative Audits
Peer reviews are a powerful way to ensure accuracy while minimizing redundant efforts [22]. For instance, one major retail company streamlined its audit process, cutting redundancy by 30% and shaving three weeks off its timeline by improving collaboration between internal and external reviewers [22].
To make the most of peer reviews:
Schedule regular audit meetings to align on objectives and deadlines.
Share audit reports, compliance findings, and key financial data to help reviewers identify issues.
Clearly define roles to prevent overlapping efforts.
This collaborative approach not only enhances accuracy but also makes the review process more efficient.
Leveraging Automated Validation Tools
Automated tools powered by AI and machine learning can catch errors that manual reviews might overlook. Take Polaris, for example. The company used MindBridge to analyze 100% of its general ledger transactions. This AI-driven approach replaced traditional threshold-based reviews with dynamic risk profiling, automatically identifying anomalies and freeing up resources for more valuable analysis [23].
“It’s like starting on Chapter 10 instead of building everything yourself.”
Even within Excel, you can use built-in features to improve error detection:
Conditional formatting: Highlight cells with missing or incorrect data.
Data validation: Set input constraints to prevent invalid entries.
ROUND function: Minimize rounding errors.
Named ranges: Replace hard-coded variables to reduce reference errors.
“Prevention is always better (cheaper) than the cure so be sure you follow best practice and keep your spreadsheets hygienically sound.”
Establishing routine audits to review formulas and validate accuracy is essential. History shows how even small errors can lead to major consequences. For example, the Reinhart-Rogoff controversy stemmed from a basic Excel mistake in a research paper, sparking widespread debates over government debt and economic growth [24]. By combining automated tools with thorough peer reviews, you can create a robust process for error prevention, ensuring your financial models remain reliable and resilient.
9. Overly Complex Models
As we’ve discussed earlier, errors in formulas and data can wreak havoc on financial models. Adding excessive complexity to these models only makes things worse. Overly detailed financial models can be a nightmare to maintain, troubleshoot, or even understand when issues arise. Instead of enhancing decision-making, they slow things down and increase the chances of mistakes, leaving decision-makers frustrated and confused [26].
In the commercial real estate world, many decision-makers are more comfortable navigating deals and property management than deciphering intricate spreadsheets. Presenting them with a model packed with nested formulas and convoluted calculations often creates more barriers than solutions [25]. Complexity doesn’t just obscure the logic - it amplifies errors and makes the model less accessible to the very people who need it.
Recognizing When Your Model Is Too Complex
Just like error checks help catch mistakes, identifying when your model is too complicated can prevent misinterpretation. A good rule of thumb: if someone with financial modeling experience can’t quickly grasp your model’s logic, it’s probably too complex. Other red flags include formulas that stretch across multiple lines, calculations buried within other calculations, or the need for extensive documentation just to explain basic functions. A model that’s too complicated invites errors, misinterpretations, and even misuse [9], increasing the risk of incorrect data inputs or faulty conclusions.
The Power of Simplicity
“All models are wrong, but some are useful.”
This quote perfectly captures the essence of effective financial modeling. Simplicity and clarity are far more practical than overloading your model with unnecessary detail. A straightforward model is easier to understand, less prone to errors, and more likely to be used consistently across your team [25]. When everyone can follow the logic, it fosters better communication, standardization, and decision-making. Simplicity isn’t just about making things easier - it’s about making them work better.
Practical Steps to Simplify Your Models
Focus on key financial drivers: Strip away calculations that don’t directly impact the final outcome [18].
Break down complex calculations: Instead of cramming everything into one massive formula, split it into smaller, logical steps across multiple cells. This makes the model easier to follow and troubleshoot [18].
State assumptions clearly: Avoid burying assumptions within formulas. Make them visible and adjustable to keep the model flexible without overcomplicating it [2].
Use straightforward formulas: Avoid overly nested IF statements. Instead, use helper columns to break down logic into manageable pieces. Group rows and columns for better organization, and add footnotes or comments to clarify without cluttering [18].
10. Missing Sensitivity Analysis
Even the most accurate models can mislead decision-makers if they fail to account for uncertainty. A model that presents a single outcome based on fixed assumptions creates a false sense of stability. Sensitivity analysis steps in to address this by quantifying how uncertainty impacts your model. This process turns static forecasts into dynamic tools for better decision-making.
“Sensitivity analysis is a financial model created to determine how different sources of uncertainty can contribute to the financial model’s overall uncertainty.”
Sensitivity analysis, often called "what-if" analysis, examines how changes in key inputs affect outcomes [27][28]. It shifts your model from a rigid, one-scenario approach to one that highlights potential risks and opportunities. This is especially valuable in commercial real estate, where variables like occupancy rates, rental growth, or cap rates can significantly alter returns.
The Cost of Ignoring Uncertainty
Take Euro Disney as a cautionary tale. Disney relied on models based on its other parks, assuming visitors would plan multi-day stays. This prompted the development of luxury hotels within the park. However, most visitors only came for day trips. These fixed assumptions led to massive debt and revenue shortfalls. Without sensitivity analysis to explore scenarios like lower visitor spending, Disney was left to deal with costly trial-and-error decisions [30].
Implementing Sensitivity Analysis
You don’t need advanced tools to perform sensitivity analysis - Excel can do the job. By creating sensitivity tables, you can test how changes in critical variables affect outcomes. The key is focusing on the variables that matter most.
Start by grouping all your assumptions in one section of your model and using a distinct font color to make them easy to spot [31]. Instead of testing every input, zero in on the ones with the greatest impact [31].
For example, in a commercial real estate investment, you might analyze how a 10% increase in customer traffic affects transaction volume. Studies show that such an increase can lead to a 5% rise in transaction volume, or even a 7% sales boost in malls [27][28]. This kind of analysis helps pinpoint the most critical factors to monitor.
Making Results Actionable
Once you’ve identified the key variables, the next step is to visualize the results. Use charts and graphs to clearly communicate how changes in these variables affect outcomes [31]. For instance, a simple table showing how different occupancy rates and rental growth scenarios impact the internal rate of return can be more insightful than pages of dense calculations.
It’s also important to test a range of realistic scenarios and update your assumptions as market conditions evolve [29]. This keeps your analysis relevant and ensures you’re prepared for shifting trends.
Sensitivity analysis doesn’t just make your models more robust - it also builds trust. By testing multiple possibilities, it transforms your model into a comprehensive tool that helps stakeholders understand both the risks and opportunities of an investment [28].
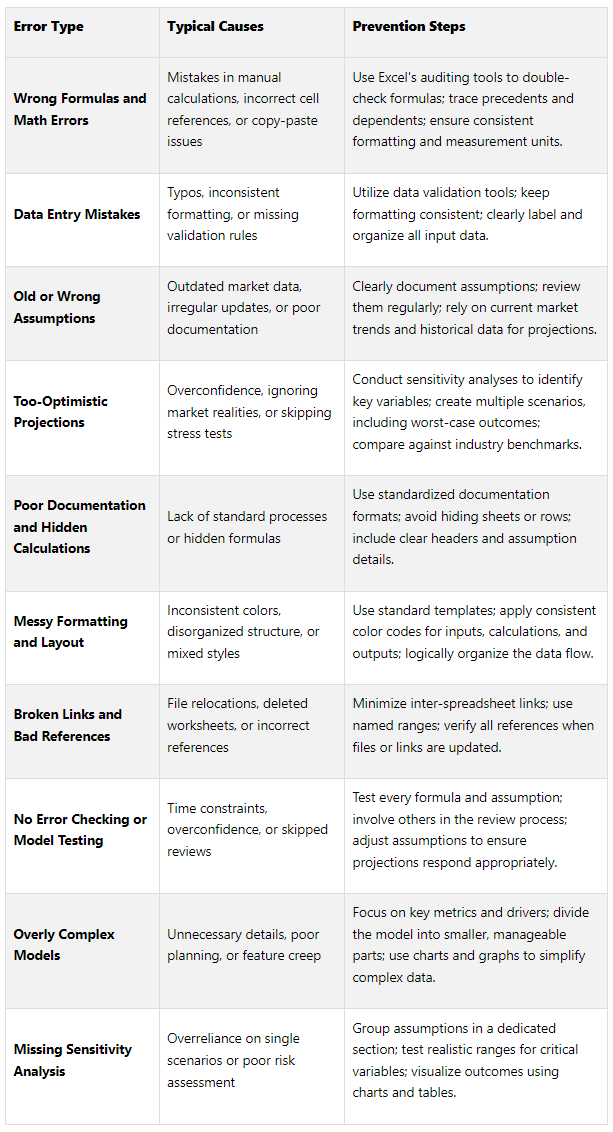
Error Prevention Quick Reference Table
Here’s a handy checklist to help you avoid common pitfalls in financial modeling.
To further safeguard your model, adopt disciplined practices like saving backup copies before major edits, disabling iterative calculations while editing, and ensuring all sections of the model are updated after changes. Use version control with cloud storage or detailed change logs to track modifications effectively.
For balance sheet models, pay extra attention to formulas. Check for incorrect signs, wrong cell references, missing parentheses, or circular references. Excel’s Row Differences function or manual checks can help ensure consistency. A thorough error-checking process not only prevents cascading mistakes but also strengthens the reliability of your model.
Conclusion
Creating accurate financial models requires discipline, structured processes, and the right tools. As Ruth McKeever aptly pointed out:
“The reliability of a spreadsheet is essentially the accuracy of the data that it produces, and is compromised by the errors found in approximately 94% of spreadsheets.”
This striking figure highlights why error prevention is critical for commercial real estate professionals. Even a single miscalculation can unravel an investment thesis, leading to missed opportunities or significant financial setbacks.
The ten common errors - ranging from formula inaccuracies to neglecting sensitivity analysis - can have serious consequences. Research shows that 75% of successful real estate investments depend on comprehensive financial modeling, with proper modeling capable of increasing returns by up to 30% [32]. Additionally, projects backed by detailed models are 50% more likely to secure financing [32].
To help tackle these challenges, The Fractional Analyst offers tailored services, including underwriting, asset management support, and custom financial model creation. We also provide free downloadable templates for multifamily acquisitions, mixed-use developments, and IRR analysis, ensuring your projections meet institutional standards.
The goal isn’t perfection - it’s about building models that are reliable, transparent, and capable of supporting confident decisions. By addressing common errors and leveraging professional insights, you can create models that drive better outcomes. With disciplined processes, regular testing, and expert guidance, commercial real estate professionals can turn potential pitfalls into competitive advantages in an ever-evolving market.
FAQs
-
To create and maintain a reliable financial model, prioritize clarity and organization. Start with a well-structured layout that’s easy to follow, steer clear of hard-coded numbers, and make sure all elements - like cash flow statements and balance sheets - are seamlessly connected. Regular reviews and validation steps, such as stress testing and sense checks, can help you identify and address potential errors early.
Document your assumptions clearly, use version control to keep track of changes, and perform detailed reviews before finalizing your model. By combining these best practices with continuous checks, you can ensure your financial model stays accurate, dependable, and compliant with U.S. standards for currency, dates, and formatting.
-
To make the most of sensitivity analysis in financial models, start by pinpointing the critical input variables - like revenue growth rates, operating costs, or interest rates. Then, evaluate how changes in these factors affect key outcomes such as net income or cash flow. Tools like Excel’s Data Tables or Goal Seek are particularly handy for running these analyses efficiently.
By exploring a range of realistic scenarios, you can identify which variables have the biggest impact on your results. This process not only helps you spot potential risks but also reveals areas of opportunity, enabling your model to guide smarter, more strategic decisions.
-
Keeping your financial model assumptions current is essential because outdated assumptions can throw off forecasts and lead to poor decision-making. Markets shift, costs fluctuate, and operational conditions evolve. Ignoring these changes in your model can make its outputs unreliable.
Using outdated assumptions puts businesses at risk of misusing resources, underplaying risks, or overlooking growth opportunities. This can derail strategic planning and lead to choices based on faulty or outdated information. By consistently reviewing and refreshing assumptions, you ensure your financial models remain accurate, relevant, and a reliable tool for smart business decisions.