
Sensitivity Analysis Checklist for Real Estate Models
Here’s the quick takeaway:
What It Does: Tests how changes in key variables (e.g., rents, interest rates) impact your returns.
Why It’s Important: Helps assess risks, make better decisions, and improve financial forecasts.
Key Variables to Test:
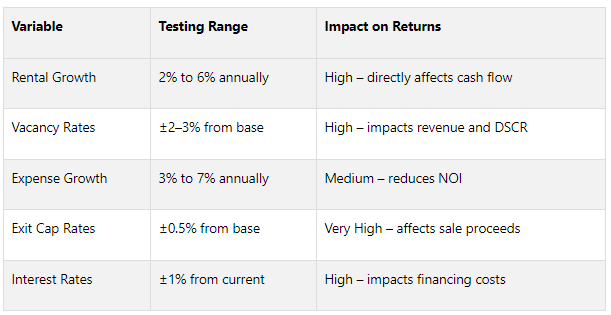
Rental Income: Test growth rates (2%-6%) for cash flow impact.
Vacancy Rates: Adjust ±2-3% to see revenue effects.
Operating Expenses: Test 3%-7% growth to evaluate NOI changes.
Exit Cap Rates: Small shifts (±0.5%) can drastically change IRR and sale proceeds.
Financing Terms: Test interest rate changes (±1%) and LTV ratios (65%-80%).
Quick Summary Table
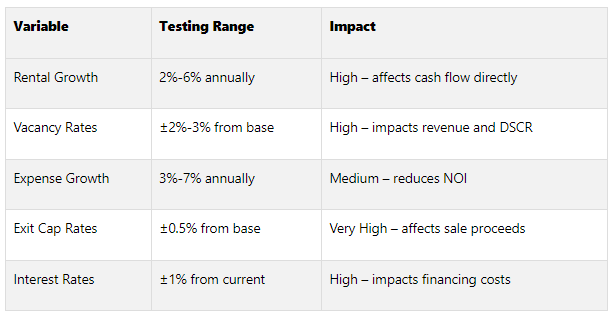
Why It Matters: A 1% interest rate hike can cut ROI by 8 points. A 5% rent drop? Major cash flow hits. Sensitivity analysis ensures you’re ready for these scenarios.
Want to know how to set it all up in Excel and interpret the results? Keep reading for detailed steps and tools.
Sensitivity Analysis - What-If Scenarios In Real Estate Financial Modeling
Key Variables to Test in Sensitivity Analysis
Conducting a successful sensitivity analysis means focusing on the variables that have the biggest impact on your investment returns. These key drivers directly influence the profitability of a deal and typically fall into five major categories. Let’s break them down.
Rental Income and Growth Rates
Rental income forms the backbone of your cash flow projections, making it the most critical variable to evaluate. Use local market data to test variations in rental income and growth rates.
For rental growth, consider scenarios ranging from 2% to 6%, covering conservative, optimistic, and pessimistic outlooks. Properties with market-rate units often see noticeable increases in Net Operating Income (NOI) during inflationary periods, while high tenant turnover can push NOI up by 15–20% during strong market cycles. On the other hand, properties with long-term tenants under rent control typically experience slower growth.
In multi-family properties, which are particularly sensitive to inflation, annualized NOI growth has averaged around 6.3% during inflationary periods.
Vacancy and Occupancy Rates
Vacancy rates are a direct hit to your revenue. Even in times of strong inflation, high vacancy rates can drain cash flow and hurt returns.
Test vacancy rates by adjusting them in increments of 2–3% above and below your base assumption. For example, if your baseline is 5%, explore scenarios at 2%, 8%, and even 11% to understand the full range of potential outcomes. Urban core properties often maintain lower vacancy rates and command higher rents, while suburban properties tend to experience greater fluctuations. Always evaluate how changes in vacancy rates affect your Debt Service Coverage Ratio (DSCR), aiming to stay above the minimum threshold of 1.25.
Operating Expenses and Inflation
Operating expenses eat directly into your NOI, so they are another essential variable to test. For instance, a 5% increase in operating expenses can reduce NOI by 3–5%, depending on your expense structure.
Analyze expense growth rates from 3% to 7% annually, focusing on key categories like property taxes, insurance, utilities, and maintenance. Don’t forget to test variations in property management fees, which typically range from 3–8% of gross rental income. You might also want to explore scenarios where you implement cost-saving measures, such as energy-efficient upgrades or streamlined maintenance operations, as these can significantly impact expense ratios.
Capital Expenditures and Exit Cap Rates
Capital expenditures and exit cap rates can dramatically influence investment returns, yet they’re sometimes overlooked. Testing these variables helps refine your acquisition and disposition strategies.
For example, even a small change in the exit cap rate can lead to big differences in returns. Dropping the exit cap rate from 6% to 5% on a multifamily property could boost the Internal Rate of Return (IRR) from 14.23% to 17.99% and increase sale proceeds by about $6 million. To fully understand the impact, test cap rate changes in increments of 0.25% to 0.5% around your base assumption.
“A small change in cap rates can make or break a deal.”
As a precaution, consider adding 1–2% to your entry cap rate when modeling exit scenarios. Current market data shows cap rates for urban core properties ranging from 3.5–4.25%, suburban properties at 4.25–5.0%, and secondary markets at 4.75–5.5%.
For capital expenditures, test scenarios where costs vary 25–50% above and below your estimates. Big-ticket items like roof replacements, HVAC systems, and unit renovations often exceed budgets during inflationary periods.
Financing Terms
Financing terms, especially interest rates and loan-to-value (LTV) ratios, play a major role in your overall profitability. For instance, a 1% rise in interest rates can increase monthly mortgage payments by about 10% on a standard 30-year fixed mortgage.
Test interest rate scenarios in 0.5% to 1% increments above and below current market rates. Since monetary policy can shift over time, it’s crucial to factor in potential rate changes during your holding period.
Similarly, test different LTV ratios, ranging from 65% to 80%. Higher leverage can amplify both gains and losses, while more conservative financing provides stability but limits potential returns. Evaluate how these changes affect your cash-on-cash returns and IRR.
With these variables in focus, you’re ready to set up your Excel model for detailed sensitivity testing.
Setting Up Your Excel Model
A well-organized Excel model is the backbone of accurate sensitivity analysis, which is crucial for effective what-if scenarios. A messy model can lead to mistakes and wasted time. To ensure smooth scenario testing, focus on clear assumptions, consistent formatting, and proper cell references.
Setting Up Key Assumptions
Start by placing all key assumptions in a dedicated section, either at the top of your worksheet or on a separate tab. Keeping these assumptions clear and easy to adjust is essential. Consolidate them into one clearly labeled area. For example, you might input values like a base rental growth rate (e.g., 4.0%), a vacancy rate (5.0%), and an exit cap rate (5.5%) in prominent cells with descriptive labels. Use cell references instead of hard-coding numbers so your model remains dynamic. Double-check that each reference points to the correct cell to avoid errors.
Using U.S. Formatting Standards
Consistent formatting not only makes your model look polished but also minimizes errors. Excel offers specific formats for currency, percentages, and dates that align with U.S. standards.
To apply these formats, use the Format Cells dialog (CTRL+1):
Currency: Set to dollars ($) with two decimal places.
Dates: Use the MM/DD/YYYY format.
Numbers: Include commas for thousands and periods for decimals.
Additionally, for text entries, preformat cells as "Text" to prevent Excel from automatically changing inputs (e.g., turning "1/2" into a date). Select the cells, press CTRL+1, and choose "Text" from the Category list.
Creating Named Ranges and Input Cells
Named ranges can transform confusing cell references into clear, error-resistant labels, making your formulas easier to understand and maintain. Assign meaningful names like Rental_Growth_Rate or Exit_Cap_Rate to key assumption cells. Avoid spaces in names - use underscores or camelCase instead. Excel allows names up to 255 characters, so you have plenty of flexibility.
Using named ranges ensures that your model consistently references the same cells. For instance, if your NOI calculation appears in multiple formulas, referencing a named range enhances clarity and reduces errors. As Ian Bennett FCA explains:
“I love that named ranges think like Excel thinks, and their use strongly encourages you to use great model structure and conform to modelling best practices.”
When preparing for sensitivity analysis, make sure input variables and outputs are on the same spreadsheet. The numbers in your input row and column should not link to other parts of your model. Leverage Excel functions like SUM, AVERAGE, IF, AND, and OR within your named ranges. Test your formulas with extreme values to confirm their accuracy.
With this setup in place, your model will be ready for efficient and systematic sensitivity testing in the next steps.
Running Sensitivity Analysis Step-by-Step
Once your Excel model is well-organized and your assumptions are clearly outlined, you're ready to dive into sensitivity analysis. This process helps pinpoint which variables have the biggest influence on your real estate investment outcomes, such as IRR or cash-on-cash return, guiding smarter decision-making.
Testing Variables One at a Time
Begin with a one-variable sensitivity analysis. This method isolates the effect of a single variable on your outputs, like net present value or IRR, making it easy to see the direct cause-and-effect relationships.
Before building your sensitivity table, ensure your model includes all the key inputs that directly affect the output you're analyzing. Use a set of fixed test values for clarity.
For example, to analyze how IRR changes with different holding periods, follow these steps:
Create a column with various test values (e.g., holding periods).
Link the output cell (e.g., IRR) above this column.
Highlight the range, then go to Data > What-If Analysis > Data Table.
Input the holding period cell reference in the "Column input cell" field and hit OK.
Review the results to ensure they align with your expectations. This step helps you identify trends and validate your assumptions.
Once you're comfortable with single-variable analysis, you can move on to evaluating multiple variables at the same time.
Using Excel Tools for Analysis
Excel includes several tools to make sensitivity analysis more efficient. Two of the most useful are Data Tables and Scenario Manager.
Data Tables: Ideal for analyzing one or two variables simultaneously, these tables allow you to see all outcomes in one view. For instance, if you want to assess how interest rates and loan terms impact monthly mortgage payments, you can set up a two-variable data table using a formula like
=PMT(B3/12, B4, -B5).Scenario Manager: This tool is better suited for testing more than two variables. It lets you create and compare different sets of assumptions, making it a powerful option for stress-testing your financial model. Unlike Data Tables, Scenario Manager allows you to toggle between scenarios rather than displaying all results at once. You can test up to 32 variables, making it especially helpful for more complex models.
Both tools can be accessed under the Data tab in the "What-If Analysis" section. For models requiring analysis of multiple variables, you can also use a "Scenario Switch" approach with Multidimensional Data Tables to keep your results manageable and organized.
Recording and Comparing Results
After completing your analysis, document the findings systematically. This ensures your work becomes a valuable reference for future decisions.
Summarize results in tables that highlight key insights, such as breakeven points or risk thresholds. For instance, record the maximum vacancy rate your project can handle while achieving target returns or the minimum rental growth rate needed for profitability. Include details like the analysis date, market conditions, data sources, and the reasoning behind your assumptions. Using version control is also a good practice - it allows you to track changes and compare results over time.
Additionally, validate your findings by double-checking formulas, calculations, and logic. Compare your results to historical industry data or market benchmarks to ensure they’re reasonable. Keep your calculations straightforward, and revisit your assumptions regularly to account for evolving market conditions. Whenever possible, use conservative estimates for your base-case scenarios, and clearly document any aggressive assumptions for transparency with stakeholders. Regularly updating your data and analysis will keep your models relevant and reliable.
Transform Your Real Estate Strategy
Access expert financial analysis, custom models, and tailored insights to drive your commercial real estate success. Simplify decision-making with our flexible, scalable solutions.
Understanding and Presenting Results
Turn your analysis into clear, actionable insights that connect your Excel calculations to real-world strategic decisions.
Finding High-Impact Variables
Pinpoint the variables that have the most significant influence by observing how small input changes lead to major shifts in key outputs. For example, a 1% change in interest rates might result in an 8-percentage-point swing in ROI. Comparing outcome ranges for different variables helps determine which ones require the most attention and ongoing monitoring.
Look for critical thresholds - those tipping points where a minor adjustment triggers substantial changes. A great example is the March 2025 analysis by Coldwell Banker Horizon Realty. In a $1,000,000 multifamily property case study, a single percentage point increase in interest rates (from 5% to 6%) caused ROI to drop from 15% to 11%. Conversely, a one percentage point decrease boosted ROI to 19%. This dramatic 8-percentage-point swing highlights the outsized impact interest rates can have on returns.
“Sensitivity analysis is a powerful tool that allows investors, developers, and brokers to evaluate the effects of market fluctuations and make informed decisions. By quantifying risks and opportunities, sensitivity analysis provides a roadmap for navigating uncertainty in real estate investments.”
Be aware of variables that tend to move together or amplify each other’s effects. For instance, rising interest rates might coincide with economic slowdowns, leading to higher vacancy rates and slower rental growth. Recognizing these connections can help you design more comprehensive stress-test scenarios.
Building Summary Tables
Use summary tables to compare key metrics across various scenarios. Focus on three core scenarios: base case (most likely outcome), optimistic case (favorable conditions), and pessimistic case (challenging conditions). Include essential metrics like IRR, cash-on-cash return, net present value, and debt service coverage ratio, and clearly outline the assumptions for each scenario.
To make trends easy to spot, apply conditional formatting - such as green for strong metrics and red for weak ones.
Target Corporation's 2022 operating profit forecast offers a helpful example. They used sensitivity tables to assess outcomes based on changes in revenue and operating profit margins. Their analysis revealed that about 66% of historical outcomes fell within a 1.5% to 12.5% annual revenue change range, while approximately 65% of operating profit margins stayed between 5.7% and 7.8%. Tornado diagrams further highlighted which variables caused the largest swings, with longer bars indicating greater influence on the results.
Recording Assumptions and Limits
After summarizing your insights, document the assumptions behind your analysis to ensure clarity and credibility. Create an assumptions log that explains the reasoning for each input range. For instance, if you vary cap rates, specify whether the boundaries are based on comparable sales, historical market trends, or expert advice, and include the date and source of your data.
Be upfront about the limits of your analysis. Clearly outline factors you didn’t examine, such as the combined impact of multiple adverse conditions or assumptions like unchanged tax laws. List excluded scenarios and provide a rationale for their omission.
You can also add a confidence assessment to your findings. For example, you might feel confident about rental income projections from signed leases but less certain about long-term exit cap rate assumptions. This level of transparency not only clarifies your analysis but also helps decision-makers act with better context.
A multifamily investment case study demonstrates the value of clear documentation. In this case, an investor identified that the project was especially sensitive to interest rates and operating expenses. This insight led to securing a fixed-rate mortgage and implementing cost-control measures. Such a focused approach was possible because the critical assumptions and limitations were thoroughly documented.
Using Tools and Resources
Make the most of the tools and resources at your disposal to speed up sensitivity analysis and improve the precision of your financial models. Let’s dive into some advanced Excel features and specialized platforms that can take your analysis to the next level.
Advanced Excel Features and Add-Ins
Excel offers several built-in tools that can significantly streamline sensitivity analysis. For example, Data Tables are essential for scenario analysis, allowing you to examine how changes in key assumptions impact return metrics.
If you’re dealing with repetitive tasks, VBA (Visual Basic for Applications) can be a game-changer. With VBA, you can automate processes like generating monthly financial summaries, updating multiple scenarios at once, or formatting your models to meet industry standards. While VBA does require some programming skills, even simple scripts can save hours of manual effort, especially for large-scale analyses.
For even more efficiency, consider AI-powered add-ins that simplify data extraction and formula creation. Tools like Daloopa are particularly useful for automating the extraction of financial data from documents such as 10-K filings, 8-K reports, and earnings statements. Daloopa can instantly update your Excel models with real-time data, eliminating manual entry and improving productivity.
When working with real estate cash flows, it’s critical to use XIRR instead of IRR and XNPV over NPV. These functions account for irregular cash flow timings and specific dates, which are common in real estate deals, giving you more accurate results than their standard counterparts.
You might also explore add-ins that provide real-time market data and access to financial databases. These tools can automatically update your models with the latest cap rates, rental growth figures, and financing terms, ensuring your sensitivity analysis reflects current market conditions.
Using The Fractional Analyst and CoreCast

Beyond Excel’s capabilities, specialized platforms can elevate your analysis further. Tools like The Fractional Analyst are tailored specifically for real estate financial modeling and sensitivity analysis, seamlessly integrating with Excel.
The Fractional Analyst provides a range of resources, including free, pre-built financial models designed for commercial real estate. These templates come with industry-standard formatting and built-in sensitivity analysis features. They follow widely recognized color-coding conventions - blue for inputs, black for formulas, and green for worksheet links - making them easy to use for professional purposes.
One standout tool is their "Actual & Forecast Model" Excel workbook, which combines forecasted property assumptions with actual performance data. This integration allows you to compare your sensitivity analysis predictions with real outcomes, helping you refine your assumptions and improve future risk assessments.
For more complex needs, The Fractional Analyst also offers custom services through a team of financial analysts. They can create tailored Excel tools, automate recurring reports, and build robust sensitivity analysis frameworks with real-time data integration and clear visualizations to support faster decision-making.
Meanwhile, their CoreCast platform complements Excel-based analysis by providing essential market intelligence and benchmarking tools. CoreCast, currently priced at $50 per user per month during its beta phase (with an expected increase to $105 per user per month), delivers market assumptions and comparable data that can feed directly into your sensitivity models.
This combination of Excel expertise and real estate-focused tools makes The Fractional Analyst an excellent option for professionals seeking scalable, efficient financial analysis support. Whether you’re setting up sensitivity frameworks, automating reports, or preparing investor presentations, their solutions integrate smoothly with your existing workflows while maintaining the flexibility and control you need.
Conclusion
A well-structured sensitivity analysis checklist transforms uncertainty into informed decision-making. For example, a 1% hike in interest rates can slash cash flow by thousands annually, while a 5% dip in property values can lead to substantial losses. These are not just hypothetical risks - they can directly impact your investment returns.
The checklist we've outlined helps you pinpoint the key factors that drive financial outcomes. By systematically testing variables like rental growth rates, vacancy rates, and operating costs, you're not just crunching numbers - you’re creating a strategy to navigate market fluctuations.
The real-world implications are clear: a 10% drop in rental income could shave several percentage points off your ROI, and a $5,000 increase in annual expenses might reduce ROI by 2–3%. With a structured approach, you can identify these vulnerabilities early - before they catch you off guard.
This process also enhances your ability to negotiate with solid data. For instance, being able to show that a 1% increase in cap rates could lower a property's value by hundreds of thousands of dollars gives you a clear advantage in negotiations.
Your Excel models, paired with the tools and strategies we've discussed, offer a transparent way to communicate risks and rewards to investors. This transparency fosters trust and sets realistic expectations, which are crucial for long-term success in real estate investment. A systematic approach like this not only highlights current risks but also prepares you to adapt as market conditions shift.
Using conservative estimates and regularly updating your analysis ensures your decisions stay grounded in reality, not wishful thinking. Markets evolve, but a solid sensitivity analysis framework evolves with them, keeping your investment strategies on solid footing.
In a field where a single error can cost hundreds of thousands of dollars, structured sensitivity analysis isn't just useful - it’s critical. By integrating these methods into your investment process, you establish a disciplined, data-driven approach to real estate decisions.
FAQs
-
Sensitivity analysis is a powerful tool for making smarter real estate investment decisions. It helps you see how shifts in key factors - like interest rates, rental income, or property values - could affect your financial outcomes. By running different scenarios, you can pinpoint potential risks and uncover opportunities, giving you the information you need to make well-thought-out choices.
This method also sharpens your risk management skills by identifying which variables have the biggest impact on your investment's performance. With this knowledge, you can craft strategies to reduce risks and improve returns, no matter the economic conditions. It’s a practical way to approach investments with greater clarity and confidence.
-
When analyzing real estate investments, it's crucial to pay attention to key financial and market factors that can significantly sway your outcomes. Here are some of the most important variables to consider:
Rental income: Shifts in rental rates or occupancy levels have a direct impact on your cash flow. A small change here can ripple through your entire investment.
Property prices: Market value fluctuations play a big role in determining your potential returns and exit strategies.
Operating expenses: Costs like maintenance, insurance, or property taxes can vary, directly affecting your bottom line.
Cap rates: Changes in capitalization rates influence property valuations and the overall return on investment.
Vacancy rates: Higher vacancies mean reduced income, which can hurt your property's performance.
Financing costs: Adjustments in interest rates or loan terms can shift your debt payments and cash flow dynamics.
Keeping a close eye on these variables allows you to anticipate challenges, manage risks, and make smarter decisions to strengthen your real estate portfolio.
-
To set up and run sensitivity analysis in Excel for real estate financial models, begin by identifying the main variables that influence your investment results. These might include factors like the purchase price, rental income, or interest rates. Excel's data table feature is a great tool for this. You can use a one-variable data table to see how changes in a single input affect your outputs, or a two-variable table to explore how two inputs interact and influence the results.
Take it a step further with stress testing and scenario analysis. This involves adjusting your assumptions to evaluate different scenarios - such as best-case, worst-case, and base-case outcomes. These methods allow you to uncover which factors are most sensitive and require close attention. For smooth and effective analysis, ensure your inputs are well-organized, clearly linked to your model, and easy to modify. By doing this, you'll gain a clearer understanding of how shifts in key variables can impact your real estate investment performance.